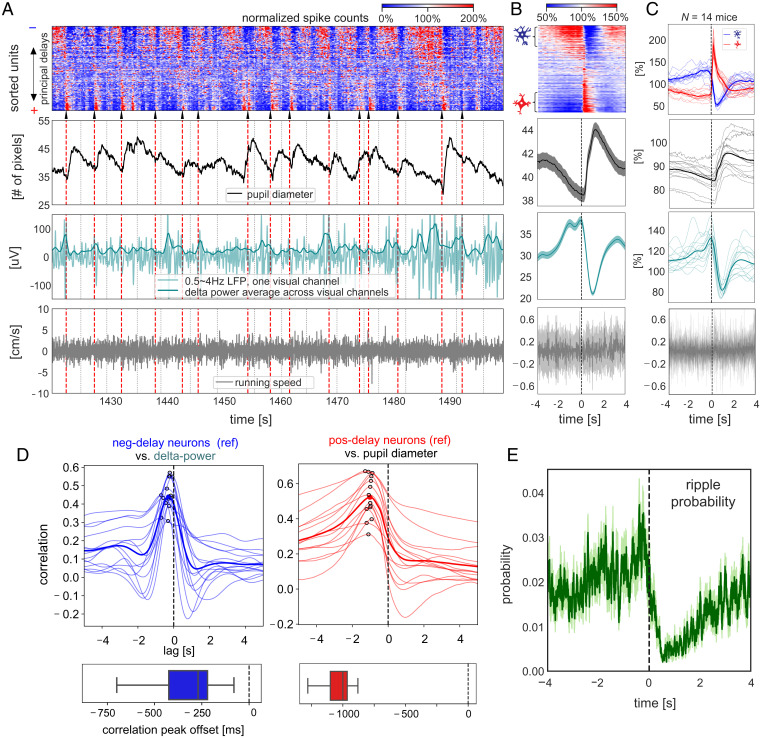
Fig. 4.
Sequential activation pattern is accompanied by seconds-scale modulations of arousal measures and hippocampal ripples activity. (A) An 80-s section of various neuronal and behavioral signals from the representative mouse. Sequential activation patterns of the spiking activity (Top) are associated with changes in pupil diameter (the second row) and delta (0.5 to 4 Hz) activity (the third row) but not running speed (the Bottom row). White/black dashed lines denote time segment boundaries. Black arrows and red dashed lines mark the sharp activation of the positive-delay neurons, according to which the time segments were aligned and averaged. The time segments with delay profile positively correlated with the principal delay profile were aligned and averaged according to the sharp activation of the positive-delay neurons within the representative mouse (B) and across all 14 mice (C). For the group results (C), the spiking dynamics of the negative- and positive-delay neurons were shown, and the thicker, darker lines represent the mean curves, whereas the thinner, lighter lines denote the results from individual animals. For the results of the representative mouse (B), the thicker, darker lines represent the mean, whereas the shadowed regions denote the regions within 1 SEM across the 14 animals. (D) Cross-correlation functions were computed between the spiking activity of negative-delay neurons (reference) and the cortical delta-power (Left), as well as between the positive-delay neurons’ spiking dynamics (reference) and the pupil diameter (Right), during the stationary period. Thin and thick lines present the results of individual animals and their average respectively, and the peak correlations are marked by hollow circles. The boxplots (Bottom) show the distribution of the time offset of peak cross-correlations. (E) The hippocampal ripple events were aligned and averaged across the time segment of sequential activations during the stationary period, similar to the other neural and behavioral signals in (C). The shadow regions represent areas within 1 SEM across the 14 animals.

