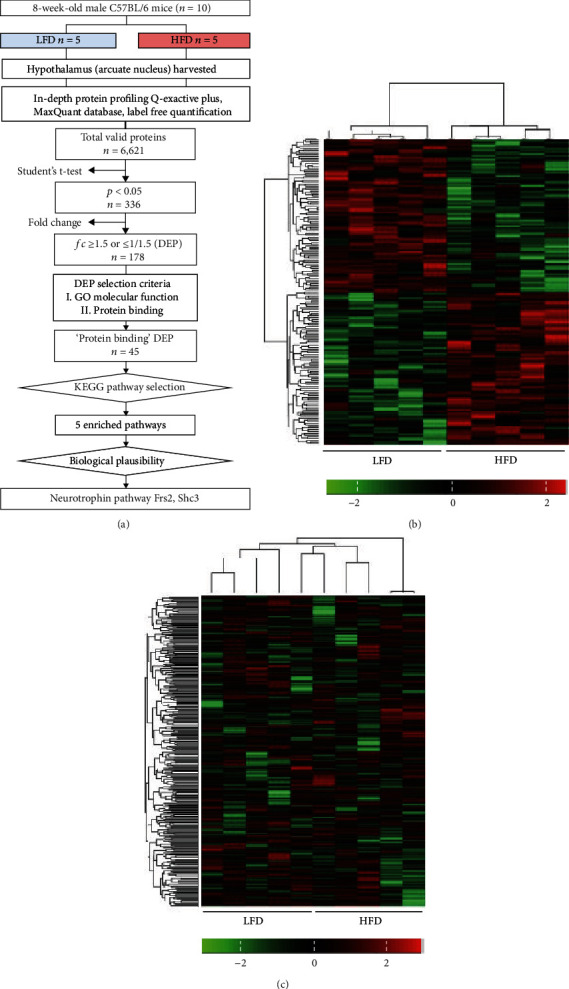
Figure 2.

Pipeline and heatmap of DEPs. (a) A total of 178 proteins were differentially expressed between the two models. Heatmap of normalized iBAQ intensity values of (b) each DEP (total 178) and (c) each valid protein (total 6,621). Scale bars are shown on the bottom right corner of each image. Left columns represent the values from the LFD group, and right columns are from the HFD group. Hierarchical clustering analysis is based on Euclidean distances. DEP: differentially expressed protein; LFD: low-fat control diet; HFD: high-fat diet.
