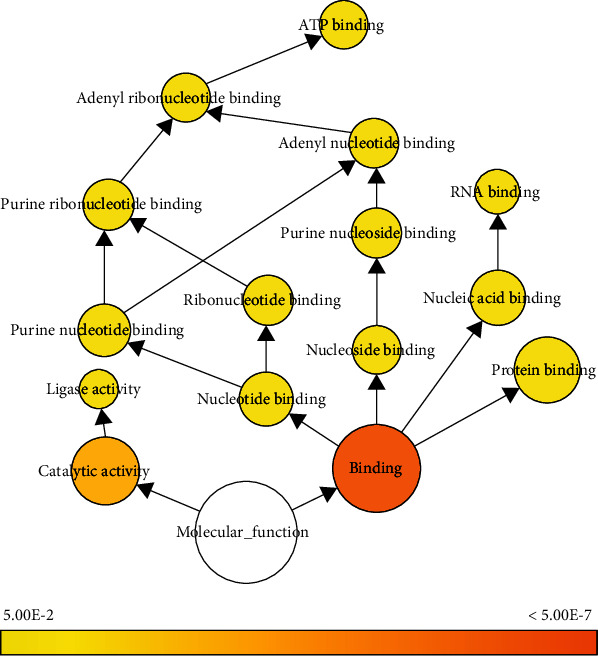
Figure 5.

Molecular functions according to GO pathways associated with DEPs and visualized using the Biological Networks GO plug-in. Colored nodes correspond to GO terms that were significant according to a p = 0.05. Node sizes represent the number of DEPs related to the corresponding GO term. GO: Gene Ontology; DEP: differentially expressed gene.
