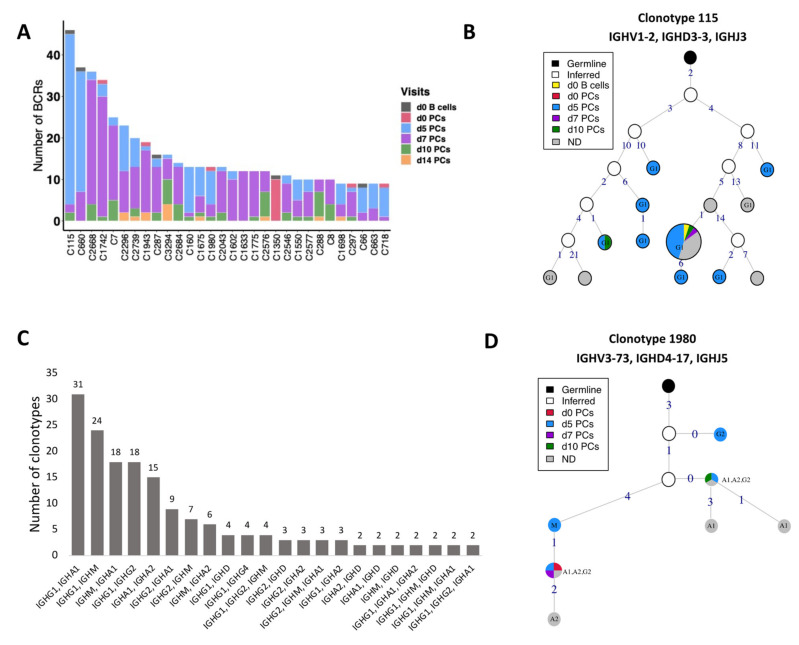
Figure 5.
BCR clonotypes over different time-points. (A) 30 most numerous clonotypes over different time-points pre- and post-vaccination. Contribution of different visits to the total size of a clone is indicated by colors. (B) Clonal lineage of clonotype 115. The graph is constructed using V gene germline sequence as the root node. The size of each node is scaled and directly related to the number of BCRs for that particular sequence. The nodes are colored based on the visits from which sequences are derived. The unique sequences present across multiple visits are also grouped and colored differently as mentioned in the legend. Germline is colored black and the inferred nodes are colored white. The edge label indicates the number of different nucleotides as compared to the previous node. (C) A bar plot indicating the >2 clonotypes containing cells with multiple constant genes. For example; each of 31 clonotypes consist of sequences using IGHG1 and IGHA1 constant genes. The number of clonotypes for each combination is mentioned on the top of bar. (D) Clonal lineage of clonotype 1980 with class-switch recombination events. Additional inferred nodes were added to correctly represent the order of class-switching.

