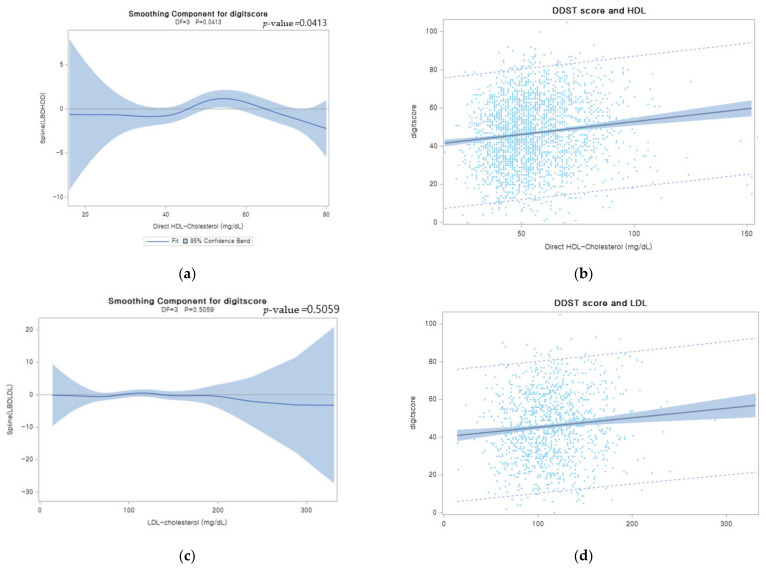
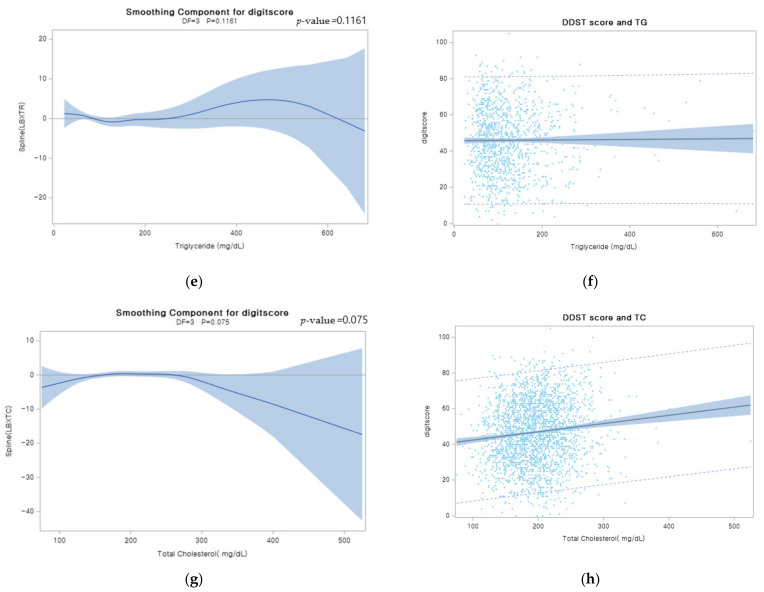
Figure 2.
Plots of smoothing spline function of digit score (a) Plots of estimated smoothing spline function of digit score with 95% confidence band for Generalized Additive Model (GAM) when the independent variable was HDL. (b) Scatter plots of HDL when the independent variable was HDL. Smoothing spline estimated on the basis of the distribution of digit score and HDL. Light blue color band indicated 95% confidence interval range of the distribution. (c) Plots of estimated smoothing spline function of digit score with 95% confidence band for Generalized Additive Model (GAM) when the independent variable was LDL; (d) scatter plots of HDL when the independent variable was LDL. (e) Plots of estimated smoothing spline function of digit score with 95% confidence band for Generalized Additive Model (GAM) when the independent variable was TG. (f) Scatter plots of HDL when the independent variable was TG. (g) Plots of estimated smoothing spline function of digit score with 95% confidence band for Generalized Additive Model (GAM) when the independent variable was TC. (h) Scatter plots of HDL when the independent variable was TC.


