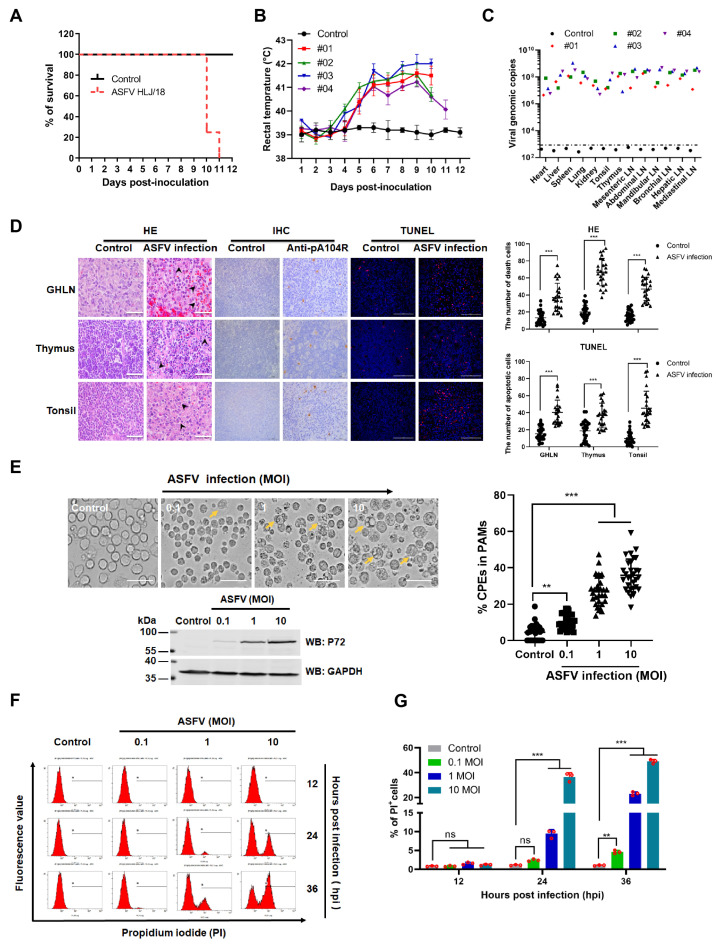
Figure 1.
ASFV infection shows tissue injury and cell death in vivo and in vitro. (A) Survival rates. (B) Rectal temperature. (C) Viral DNA of the indicated samples was detected in the dead pigs or surviving pigs that were euthanized at 12 dpi. (D) Representative images of tissue sections of gastric hepatic lymph nodes (GHLNs), thymuses, and tonsils from infected or non-infected pigs. Cell death is indicated by black arrowheads in hematoxylin and eosin-stained images (HE) (scale bar: 25 μm). Infected cells (brown) were stained by immunohistochemistry (IHC) with anti-ASFV monoclonal antibody (pA104R) (scale bar: 50 μm) and apoptotic cells were labeled with TUNEL (red) (scale bar: 100 μm). Death or apoptotic cells from 25 fields of 5 random tissue sections were counted under a 40× objective and the results (right) are shown as mean ± SD values, n = 25. The significance of the differences between the groups was determined by an unpaired t-test with Welch’s test with 2-tails (*** p < 0.001). (E) Representative images of cytopathic effects (CPEs) caused by ASFV infection in PAMs. PAMs were non-infected or infected with ASFV HLJ/18 at MOIs of 0.1, 1, or 10 for 36 h and then visualized under a microscope (left). Yellow arrows indicate CPEs. Scale bar, 10 µm. The right panels show the statistical results regarding the percentage of CPEs. CPEs from 10 fields (approximately 100 cells/field) were counted under a 20× objective and the results shown as mean ± SD values, n = 30 from 3 independent experiments. The significance of the differences between the groups was determined by the Mann–Whitney test (nonparametric t-test). (** p < 0.01, and *** p < 0.001). The expression of p72 indicated ASFV infection was detected (lower image). (F,G) ASFV caused cell death in PAMs. PAMs were infected with ASFV at MOIs of 0.1, 1, and 10. At different time points (12, 24, and 36 h) post infection, cells were harvested, stained with propidium iodide (PI), and analyzed by flow cytometry. Untreated cells were used as the control. The percentage of PI-labeled cells in (F) was quantified (G). The significance of the differences between the groups was determined by 2-way ANOVA with Tukey (** p < 0.01, and *** p < 0.001).

