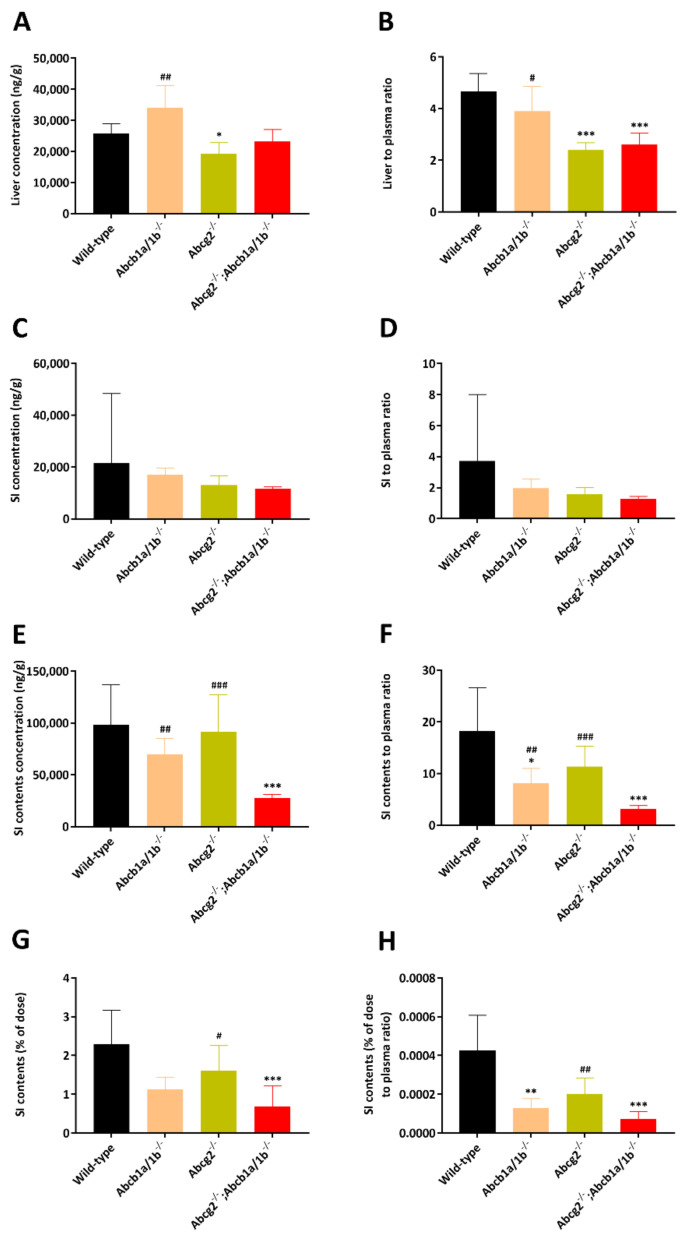
Figure 6.
Liver, small intestine and small intestine contents concentrations (A,C,E), liver, small intestine- and small intestine contents-to-plasma ratios (B,D,F), small intestine contents as percentage of dose (G) and small intestine contents percentage of dose-to-plasma ratio (H) of selpercatinib in male wild-type, Abcb1a/1b-/-, Abcg2-/- and Abcb1a/1b; Abcg2-/- mice 4 h after oral administration of 10 mg/kg selpercatinib. SI: small intestine. Data are given as mean ± S.D. (n = 6). *, p < 0.05; **, p < 0.01; ***, p < 0.001 compared to wild-type mice; #, p < 0.05; ##, p < 0.01; ###, p < 0.001 compared between Abcb1a/1b;Abcg2-/- and Slco1a/1b-/- mice. Statistical analysis was applied after log-transformation of linear data.

