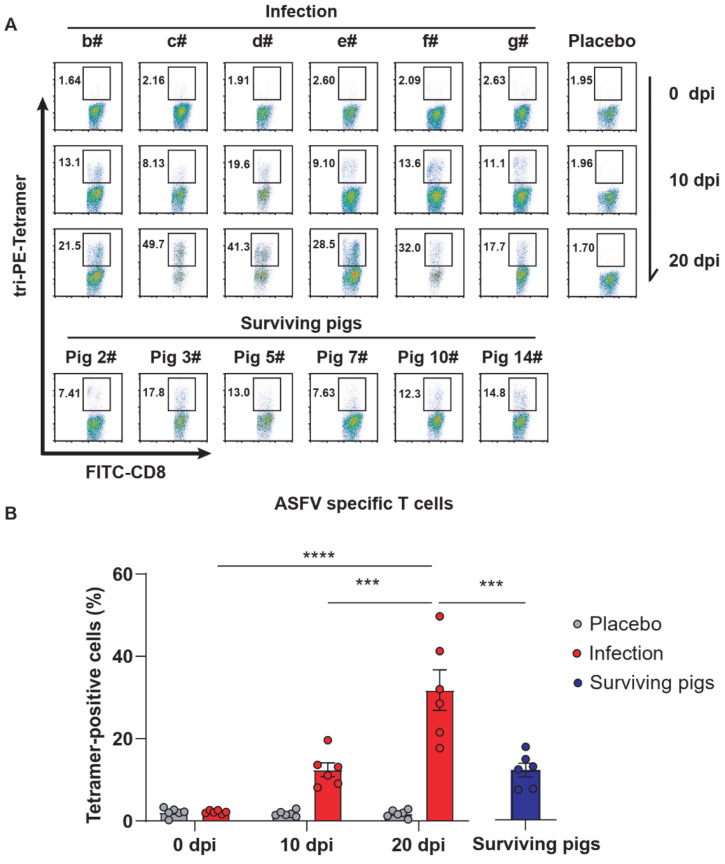
Figure 5.
Differences of CD8+ T cells between ASFV-infected pigs and surviving pigs at different time points. (A) The proportion of CD8+-specific T cells after ASFV infection was measured by flow cytometry assays of PBMCs stained with tri-PE-tetramer (the mixture of PE-Tera-P334, PE-Tera-P351, and PE-Tera-P366). (B) Statistical analysis of the proportion of CD8+-specific T cells after ASFV infection at different time points. The data are shown as the mean ± SEM. p-values were determined by one-way ANOVA (*** p < 0.001; and **** p < 0.0001).

