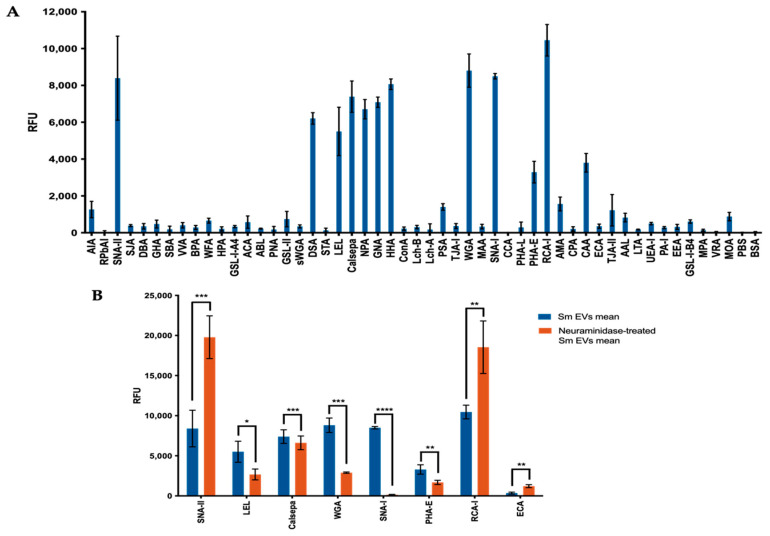
Figure 1.
Lectin microarray. Microarray slides were incubated with PKH26-labelled EVs and imaged at 532 nm in an Agilent G2505B microarray scanner at 100% PMT (A) Lectin microarray response generated for S. mansoni EVs. (B) Significant effect of neuraminidase treatment on lectin-binding at the surface of EVs. Data subjected to total intensity mean normalisation, n = 4, +/−SD. Statistics were performed using a paired t-test * p > 0.05, ** p > 0.01, *** p > 0.0005, **** p > 0.00001.

