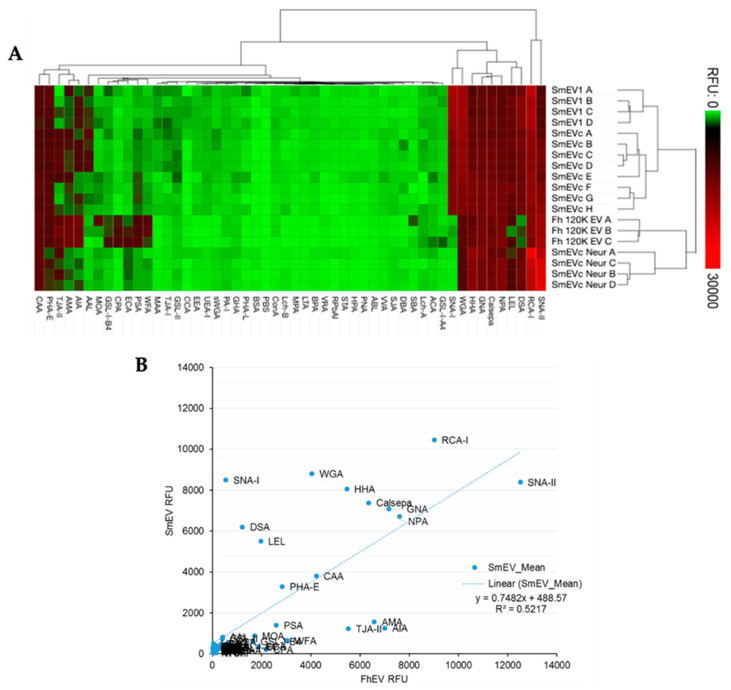
Figure 3.
Comparison of Schistosoma mansoni-derived EVs and Fasciola hepatica-secreted EVs lectin microarray profiles. (A) Heat map and two-dimensional hierarchical clustering of scale-normalised lectin microarray profile data for all twelve SmEV technical replicates, 4 from one EV isolation sample (SmEV1 A-D) and 8 from pooled EV samples (SmEVc A-H), and three FhEV replicates (Fh 120k EV A-C) obtained by de la Torre-Escudero et al. (2019). Data depicted in heat map was scaled to fit a 0–30,000 RFU window and clustered by average linkage, Euclidean distance method (B) Regression analysis comparing S. mansoni EV and F. hepatica EV lectin-binding profiles.

