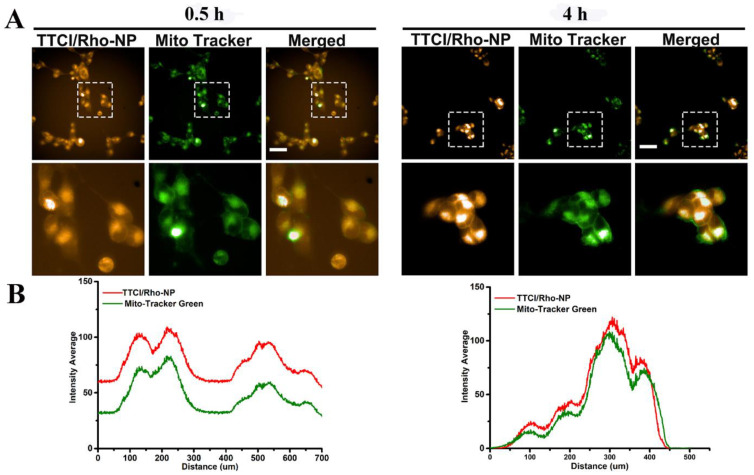
Figure 3.
Mitochondria-targeting ability of TTCI/Rho NPs in vitro: Images of the BxPC3 cells treated with TTCI/Rho NPs at a concentration of 20 µM for 0.5 and 4 h, captured by high content analysis system-operetta CLSTM. For each row, from left to right: TTCI/Rho NPs (546 nm excitations); mitochondria stained by MitoTracker Green (488 nm excitation); merged image (A). Scale bars: 50 µm. The cross-section fluorescence intensity of Rhodamine B and MitoTracker Green in the enlarged regions analyzed using imageJ software (B).

