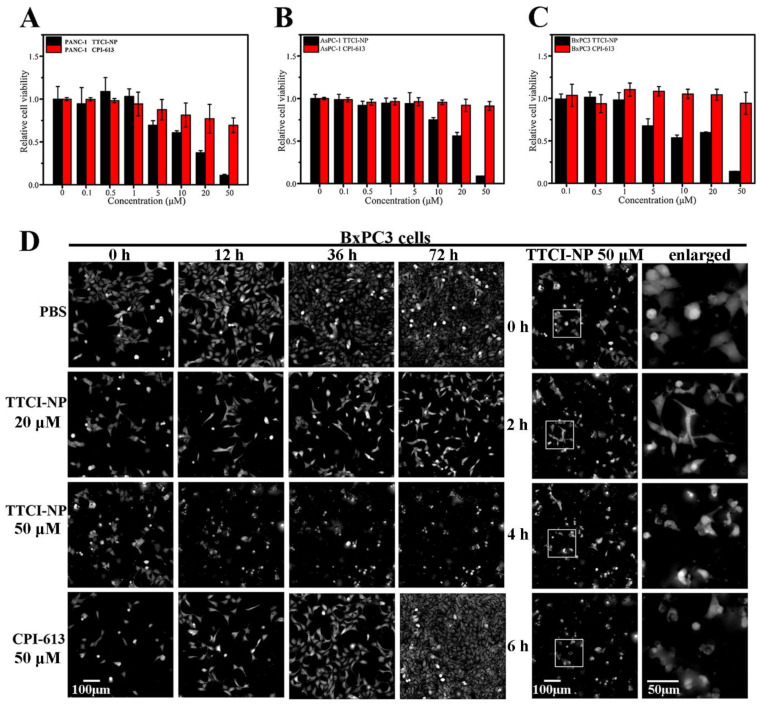
Figure 4.
In vitro cytotoxicity of free CPI-613 and CPI-613-loaded TTCI NPs at various concentrations against PANC-1 cells (A), AsPC-1 cells (B), and BxPC3 cells (C) after 48 h incubation. Data represent mean ± SD (n = 3). Digital phase contrast images of living BxPC3 cells (D) treated with PBS, 20 µM TTCI NPs, 50 µM TTCI NPs and 50 µM CPI-613 at different times. Digital phase contrast images were captured by high content analysis system-operetta CLSTM. Scale bar: 100 µm and 50 µm (for enlarged images).

