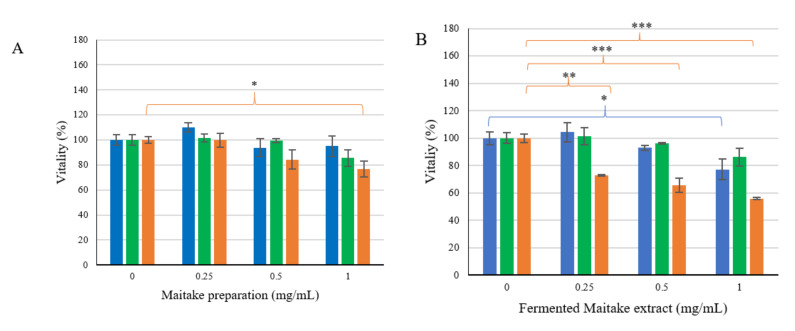
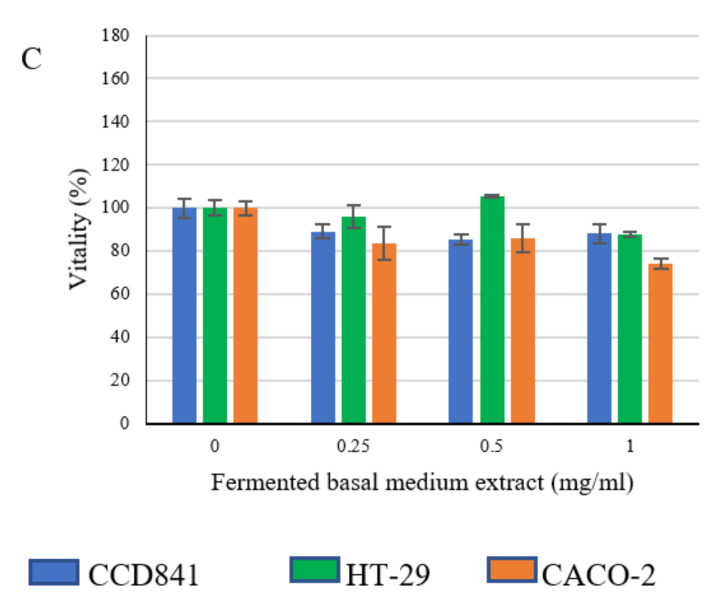
Figure 4.
Differential effects of extracted secondary metabolites on cell viability. The figure represents the viability of the three different cell lines in presence of Maitake extract (A), fermented Maitake extract (B), and fermented control medium extract (C). Values are represented as mean value of vitality % ± standard error. Statistical differences were calculated using Dunnett’s multiple comparisons test: * p-value < 0.05, ** p-value < 0.01, *** p-value < 0.001.


