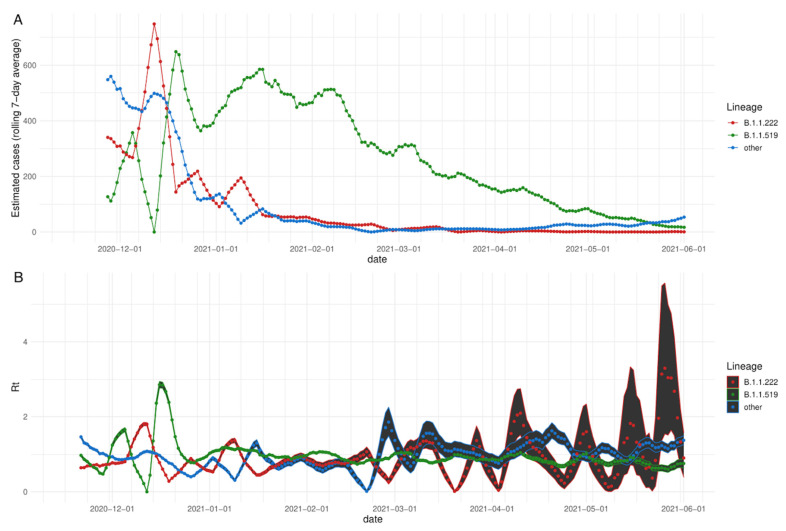
Figure 2.
(A) Estimated number of cases for each variant based on the frequency observed in sequenced samples at INMG and the daily tally of confirmed cases in SINAVE, 7-day rolling average. (B) Time series of estimated Rt. Points represent the mean estimated Rt value per variant. Ribbon boundaries indicate the 5 (lower) and 95 (upper) quantile boundaries of the estimation.

