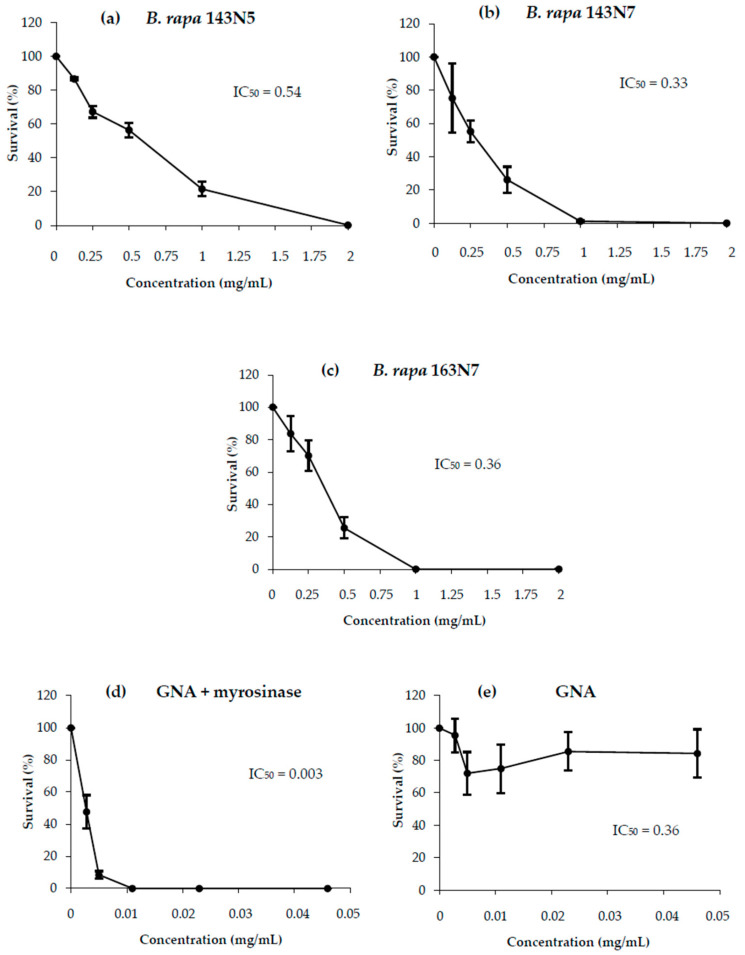
Figure 3.
Survival of HL-60 cultures treated with different concentrations of: B. rapa (a) 143N5, (b) 143N7 and (c) 163N7 plant material; bioactive compound: (d) hydrolyzed gluconapin and (e) gluconapin. Survival curves are plotted as percentages with respect to the control counted at 72 h treatment from at least three independent experiments (mean ± SE).

