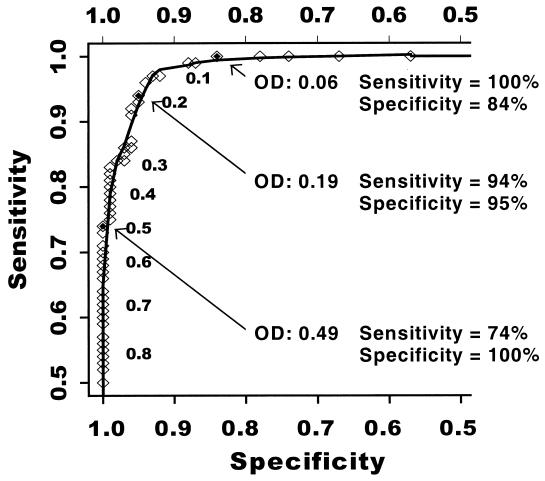
FIG. 2.
ROC curve depicting the sensitivity (y axis) and specificity (x axis) of an EIA for antibodies to HHV-8. Sensitivity was determined in reference to 135 true-positive individuals and specificity in reference to 178 individuals in the initial definition of the true-negative group. At each OD value observed upon testing the true-positive and true-negative individuals in the EIA, the associated sensitivity and specificity were calculated. The numeric OD values are given alongside the points.

