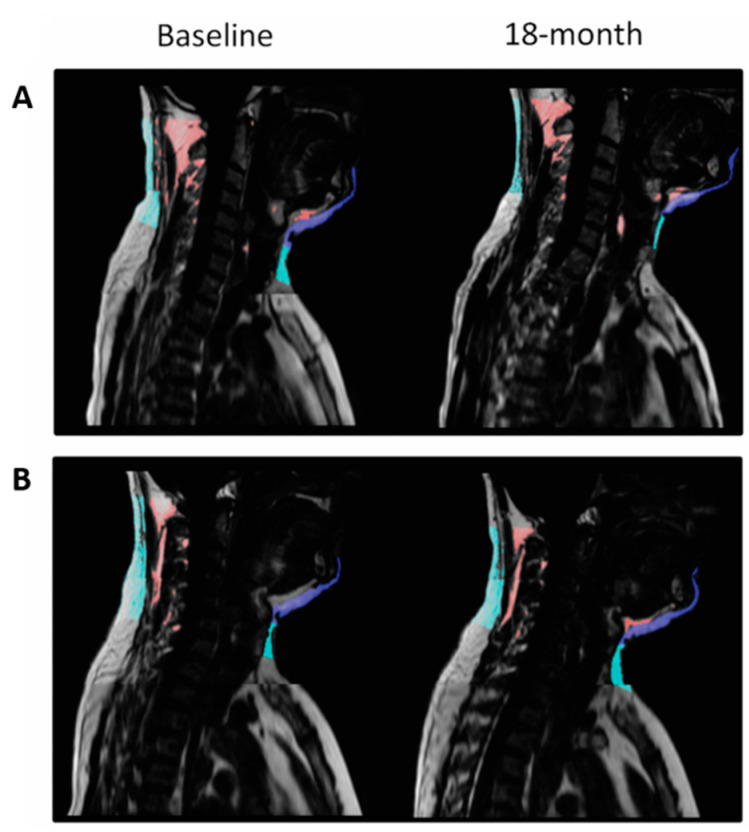
Figure 4.
MRI of cervical-SAT—comparison between two matched participants with different weight loss achievements. Panel (A) and (B) demonstrate the sagittal section of subjects A and B, respectively. Cervical-SAT was divided into color-coded compartments: light blue, cervical-SAT; dark blue, chin-SAT; and red, non-classified fat- fat beneath the fascia. Both men had a baseline weight of 83 kg and waist circumference of 105 cm; following the 18-month intervention, participant A lost 18 kg, and participant B gained 5.4 kg. The two men differed distinctly in their 18-month cervical-SAT (−51.97% vs. +2.52%) and chin-SAT (−27.5% vs. +4.82%) reductions.

