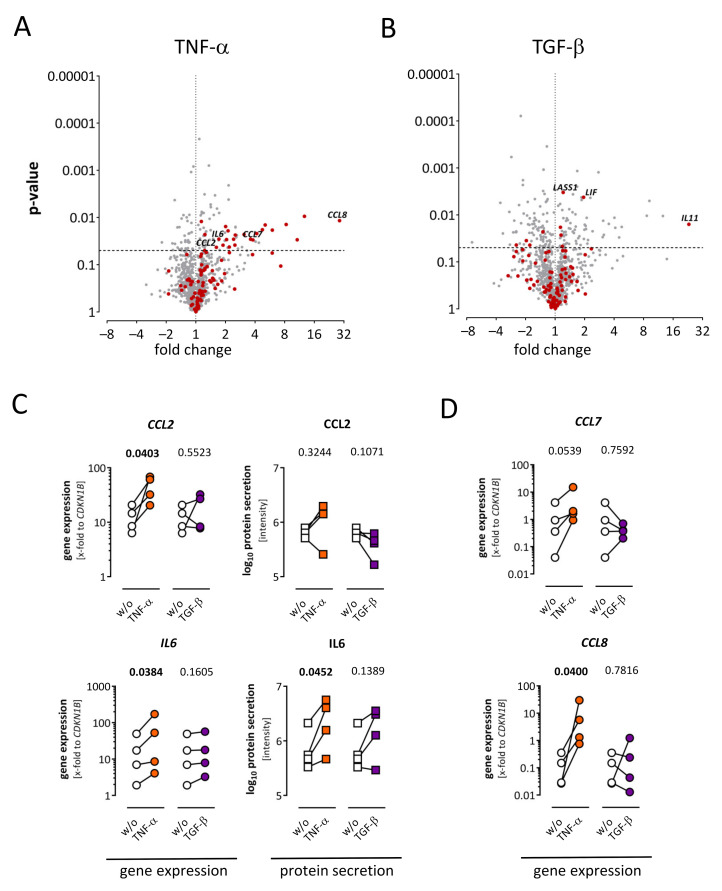
Figure 4.
Regulation of cytokines in the secretome and corresponding transcriptome of human cardiac fibroblasts after TNF-α or TGF-β treatment. (A) Fold change and p-value are displayed in the volcano plot to visualize significantly regulated genes after TNF-α treatment. Genes assigned as cytokines are highlighted in red. Out of 110 significantly regulated genes (p < 0.05), 23 upregulated cytokines were detected. (B) Fold change and p-value are displayed in the volcano plot to show significantly regulated genes after TGF-β treatment. Genes assigned as cytokines are highlighted in red. Out of 174 overall significantly regulated genes (p < 0.05), six up- and four downregulated cytokines were detected. (C) After TNF-α (orange) or TGF-β (purple) stimulation, gene expression was assessed via TaqMan analysis (dots) and protein expression in the secretome (squares) were analyzed using mass spectrometry. Supporting Affymetrix results, gene expression of CCL2 and IL6 was significantly increased in the TaqMan analysis after TNF-α but not TGF-β treatment. On protein level, IL6 but not CCL2 was also increased. (D) Gene expression analysis via TaqMan analysis replicating Affymetrix results. After TNF-α (orange) and TGF-β (purple) stimulation, CCL8 was increased in both gene expression analyses, while CCL7 was significantly changed in the Affymetrix analysis (A). In the TaqMan analysis, CCL7 was elevated in each sample but did not reach significance. Both genes were not detected by mass spectrometry. For statistical comparisons, either ratio paired t-test (gene expression data) or paired t-test (log10 protein data) was used as appropriate. Statistically significant results (p < 0.05) are highlighted in bold. ns, no significant differences; w/o, untreated controls.

