Figure 5.
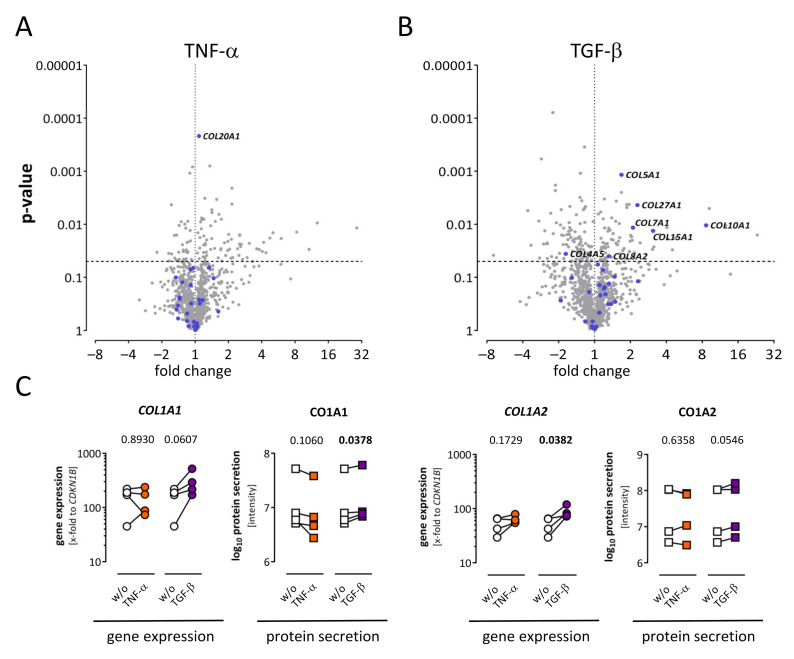
Regulation of collagens in the secretome and corresponding transcriptome of human cardiac fibroblasts. (A) Fold change and p-value are displayed in the volcano plot to visualize significantly regulated genes (p < 0.05) after TNF-α treatment. Genes assigned as collagens are highlighted in blue. One upregulated collagen was detected (COL20A1). (B) Fold change and p-value are displayed in the volcano plot to visualize significantly regulated genes (p < 0.05) after TGF-β treatment. Genes assigned as collagens are highlighted in blue. Six collagens were significantly upregulated and one collagen was downregulated. (C) After TNF-α (orange) or TGF-β (purple) stimulation, gene expression of selected genes was analyzed using TaqMan (dots), and secreted proteins were analyzed via mass spectrometry (squares). For statistical comparisons, either ratio paired t-test (gene expression data) or paired t-test (log10 protein data) was used as appropriate. Statistically significant results (p < 0.05) are highlighted in bold. ns, not significant; w/o, untreated control.

