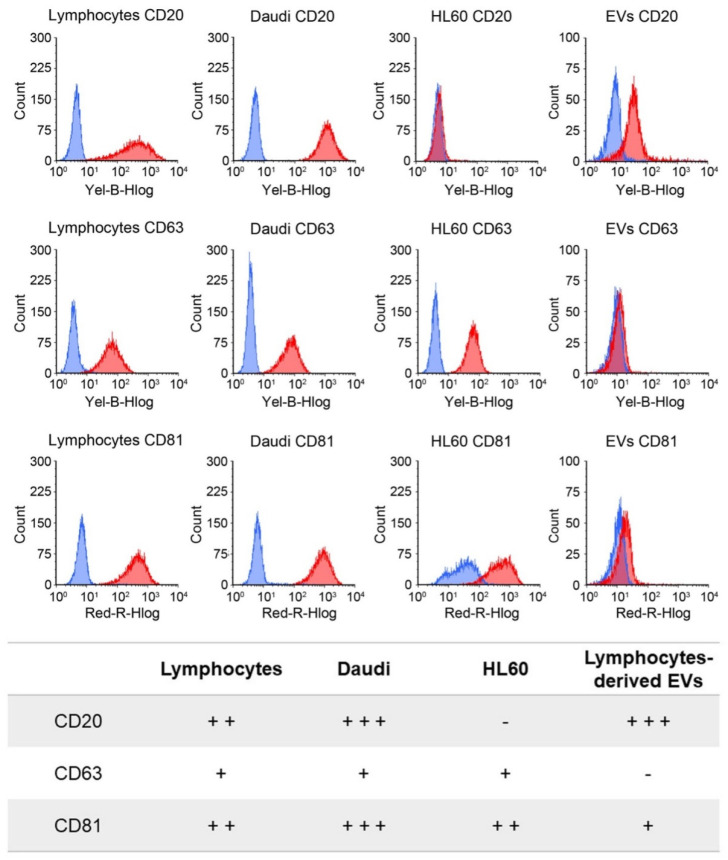
Figure 3.
Cytofluorimetric evaluation of CD20, CD63, and CD81 marker expression levels on the plasma membrane of the three different cell lines and on the lymphocyte-derived EV membranes. In the upper panel, representative histograms of the expression of the different markers are reported for lymphocytes, Daudi, HL60, and EVs (blue represents the isotype controls, and red represents the related tested antigen). In the lower panel, the expression levels are grouped into negative (–), low (+), intermediate (++), and high (+++) categories, corresponding to the following signal intensities: <10, 10–100, 100–500, and 500–1,000, respectively, for cells and <1.5, 1.5–5, 5–10, and 10–20 for EVs.

