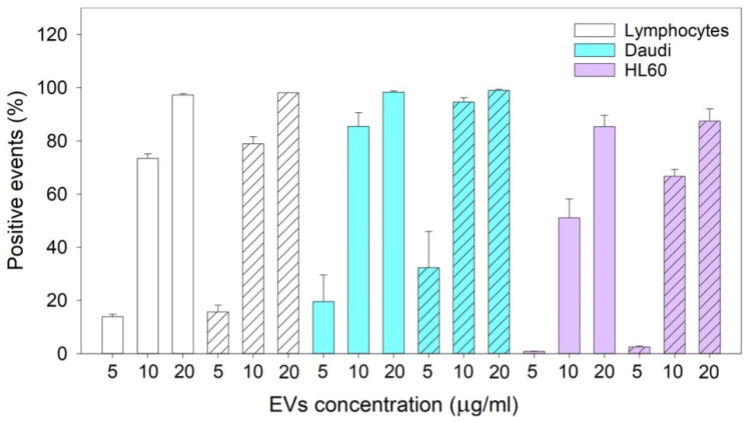
Figure 5.
The graph bar represents the mean and the SE of the results of nEVs’ uptake in lymphocytes, Daudi, and HL60 cell lines at different concentrations (5, 10, and 20 μg/mL) at 24 (solid color bars) and 48 (dashed bars) hours. Plotted data are the mean ± SE. The comparisons between cell lines, times, and types of treatments were performed using the three-way ANOVA test, and the statistical significance is reported in the main text. Independent experiments were carried out two times.

