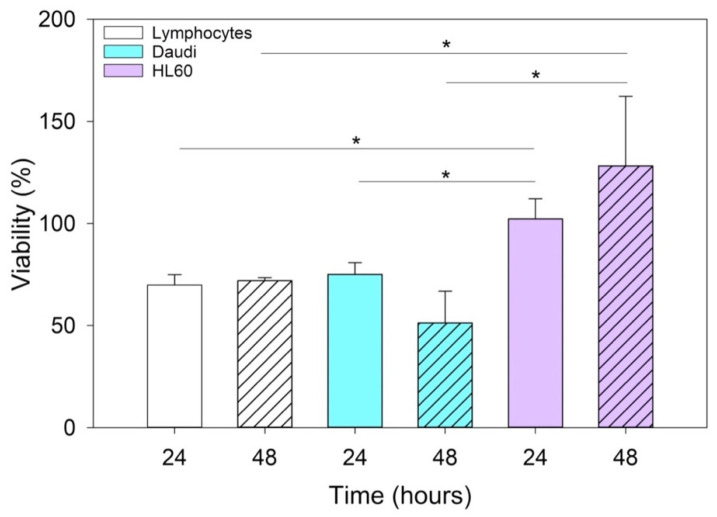
Figure 7.
Histograms represent the mean and the SE of the EVCD20 viability data in lymphocytes, Daudi, and HL60 cell lines treated with 5 μg/mL of EVsCD20 solution for 24 and 48 h. The comparisons between cell lines and times of incubation were performed using two-way ANOVA; * p < 0.05. Independent experiments were performed three times.

