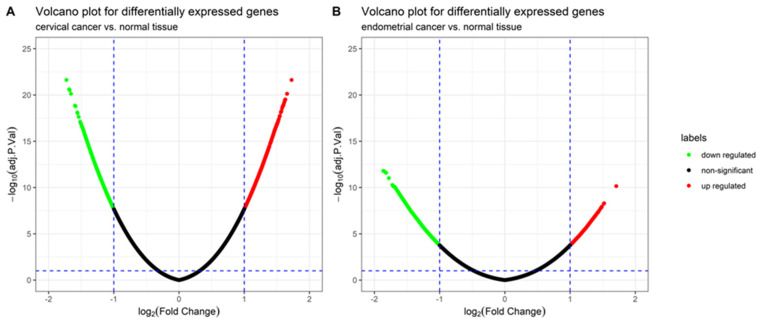
Figure 1.
Volcano plot for the differentially expressed genes (DEGs) in two gynecologic tumor types: (A) The volcano plot of 920 DEGs between cervical cancer and normal tissue, including the 572 upregulated genes (red color) and 348 downregulated genes (green color). (B) The volcano plot of 843 DEGs between endometrial cancer and normal tissue, including the 213 upregulated genes (red color) and 630 downregulated genes (green color).

