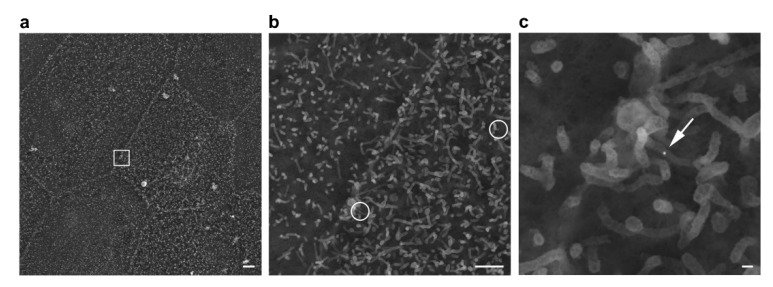
Figure 4.
Scanning electron microscopy of C-CPE-AuNPs on a 0846-FusionRed cell. (a) 2000× overview of the cell culture and stepwise higher magnification of a cell–cell border area presented in (b) 10,000× with AuNPs encircled and (c) 40,000× detailing a 25 nm AuNP (arrow) on surface microvilli. The white box outlined in (a) indicates the area magnified in (c). Scale bars are 2 µm, 1 µm, and 100 nm, respectively.

