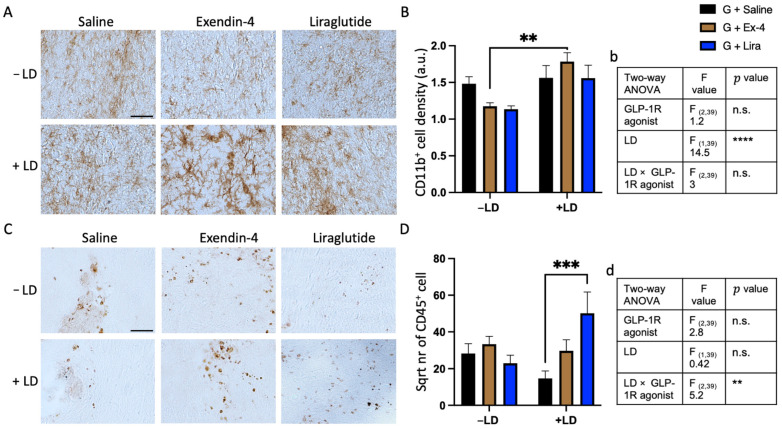
Figure 5.
Quantification of CD11b+ microglia and CD45+ leukocyte in the striatum of the grafted rats. (A,B) Bright field images showing CD11b+ cells density and morphology around the graft and their quantification respectively in the striatum of the rats received either saline, exendin-4 or liraglutide and +/− LD. (C,D) Bright field images showing CD45+ cells number and their quantification respectively in the striatum of the rats received either saline, exendin-4 or liraglutide and +/− L-dopa. (b,d) illustration of statistical sumary of (B,D) analysis respectively. Two way ANOVA ** p < 0.01, *** p < 0.001, **** p < 0.0001. n = G − LD (7), G + LD (8), G − LD + Ex-4 (9), G + LD + Ex-4 (8), G − LD + Lira (6), G + LD + Lira (7). n.s. = not significant LD = L-dopa; Ex-4 = Exendin-4; Lira = Liraglutide TH = tyrosine hydroxylase. Scale bar (A,C) = 100 μm.

