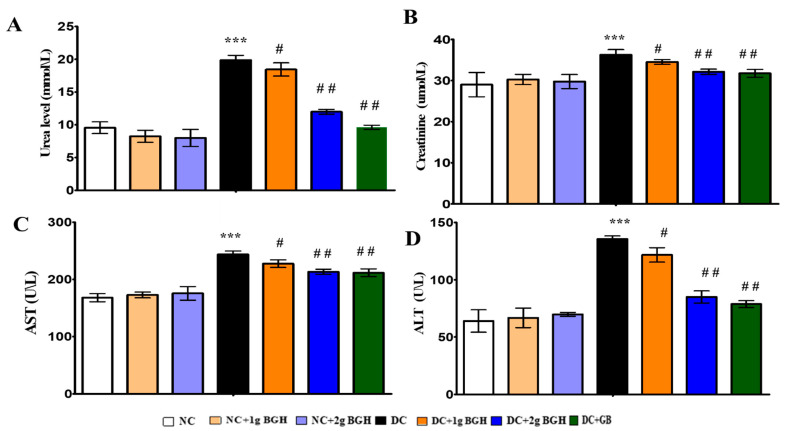
Figure 3.
Bar charts showing the effect of BGH on liver and kidney functional markers: (A) Urea levels, (B) Creatine levels, (C) Aspartate aminotransferase (AST) levels, (D) Alanine aminotransferase (ALT) levels. The results were collected from six separate rats within every treatment group and were reported as a mean ± S.E.M. *** p < 0.001 vs. NC; # p < 0.05; ## p < 0.01 vs. DC. NC: Normal control; NC+1g BGH: Non-diabetic rats that received 1 g/kg/day BGH; NC + 2 g BGH: Non-diabetic rats that received 2 g/kg/day BGH; DC: Diabetic control; DC + 1 g BGH: Diabetic rats that received 1 g/kg/day BGH; DC + 2 g BGH: Diabetic rats that received 2 g/kg/day BGH; DC + GB: Diabetic rats that received 2 mg/kg/day glibenclamide.

