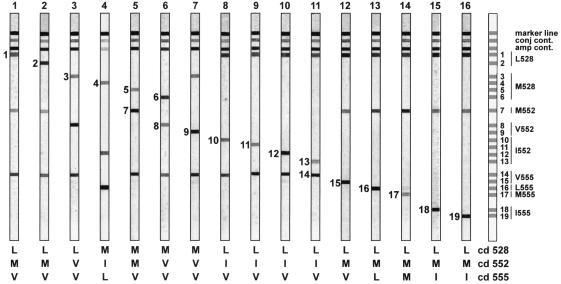
FIG. 4.
HBV LiPA strip results illustrating the reactivity of each independent probe line. Results are obtained with a selection of the reference panel shown in Fig. 2. Reactive lines are indicated with their number. A strip showing the relative positions of all lines on the strip is indicated on the left. Interpretation for each codon is given below each strip. conj cont., conjugate control; amp cont., amplification control.

