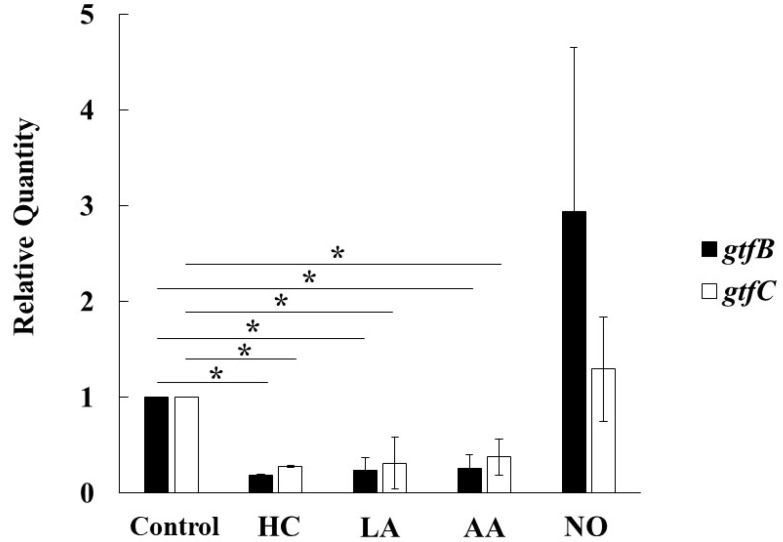
Figure 7.
Effects of initial pH condition on expression of gtfB and gtfC in the MVs. Expression of gtfB and gtfC was quantitatively assessed by real-time PCR in 6 h incubation of S. mutans UA159 in initial pH 6.0 condition prepared with HC, LA and AA, and initial pH 8.0 condition prepared with NO, and compared with control condition. The data of relative expression in test conditions to control condition indicate the mean ± SD of three independent experiments. The asterisks indicate a significant difference between the groups (*: p < 0.05, MVs in control condition vs MVs in initial pH 6.0 and 8.0 conditions).

