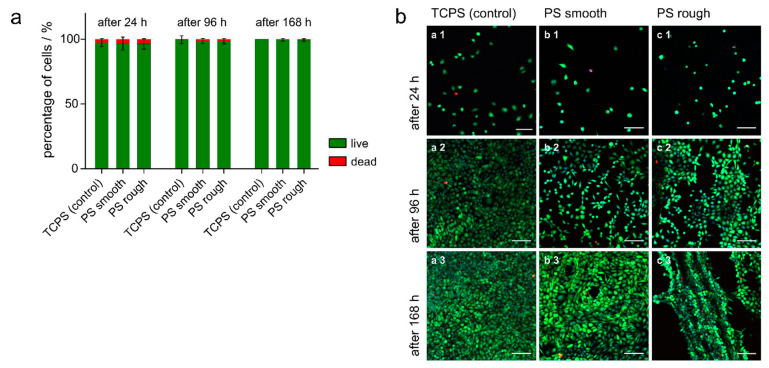
Figure 6.
Results of the live/dead staining containing calcein-AM (green fluorescence, viable cells), PI (red fluorescence, dead cells) and Hoechst (blue fluorescence, all cells). Three independent experiments were carried out in triplicate. Four images per sample were taken (36 per condition per time point). (a) Percentages of live (green) and dead (red) L-929 cells grown on TCPS and FDM-printed PS substrates (smooth and rough surfaces) after 24 (left), 96 (middle) and 168 h (right). (b) Representative confocal LSM images of L-929 cells cultured for 24 (1), 96 (2) and 168 h (3) on TCPS (a) and FDM-printed PS substrates (b: smooth surfaces, c: rough surfaces) after a live/dead staining (scale bar 100 µm).

