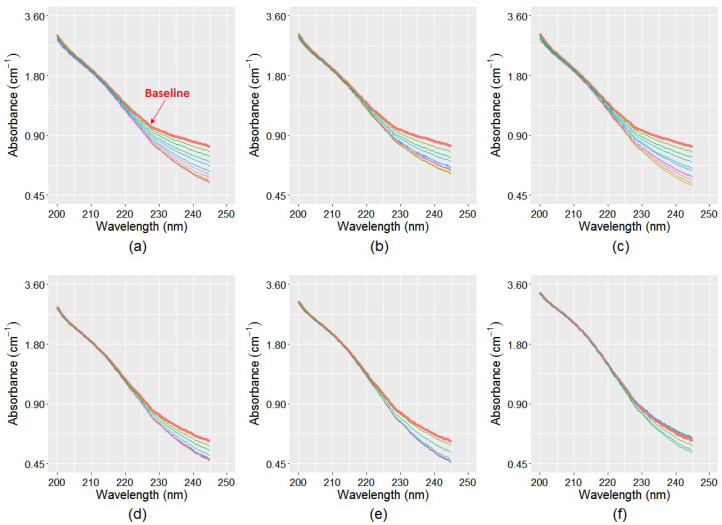
Figure 6.
Estimated spectra without the influence of NOx− absorbances for the six samples for a period of eight weeks: (a) TB-WTP unprocessed sample; (b) TB-WTP 0.22 μm filtered sample; (c) TB-WTP enhanced sample; (d) Meningie unprocessed sample; (e) Meningie 0.22 μm filtered sample; and (f) Meningie enhanced sample. Spectral change is assumed to be caused by monochloramine decay only. Compared to Figure 5, the subsequent spectra in all samples in Figure 6 do not cross the baseline, as no NOx− absorbances are considered.

