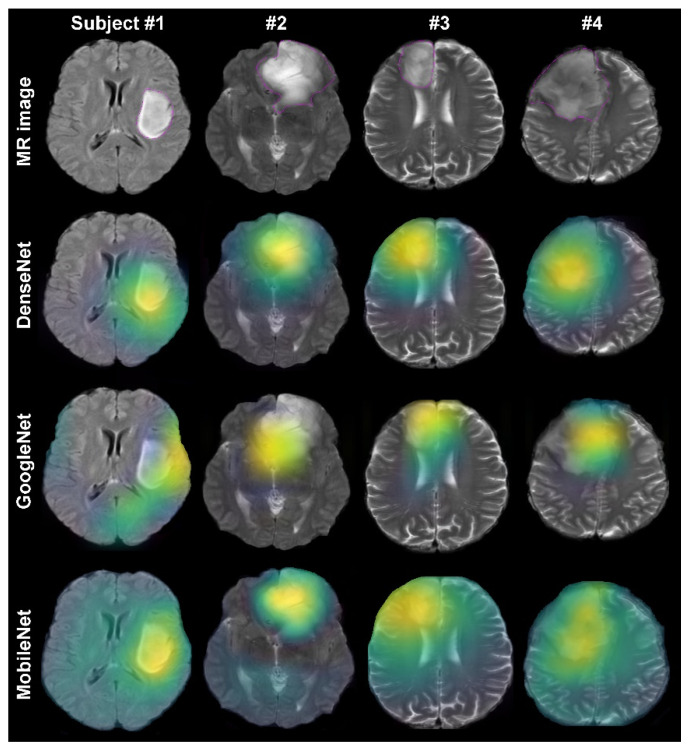
Figure 1.
Heatmap visualization overlaid on tumor lesions for different training networks. The top row depicts the original MR image examples from four subjects. The magenta counters indicate the tumor lesion boundaries. The bottom rows show the Grad-CAM visualizations for three different training algorithms on the selected axial slices.

