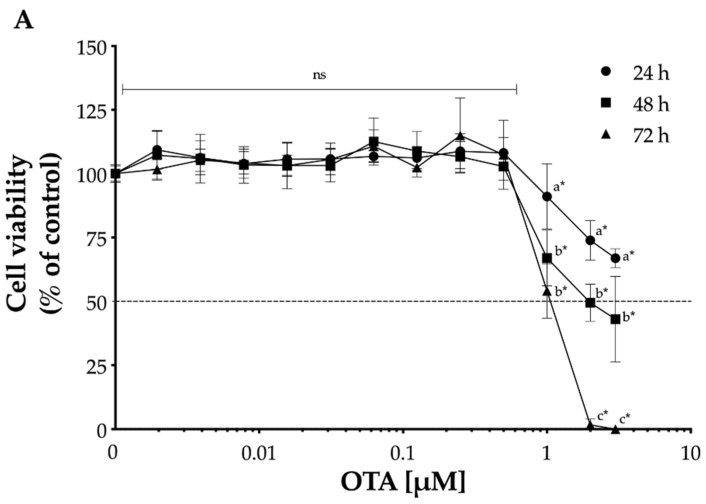
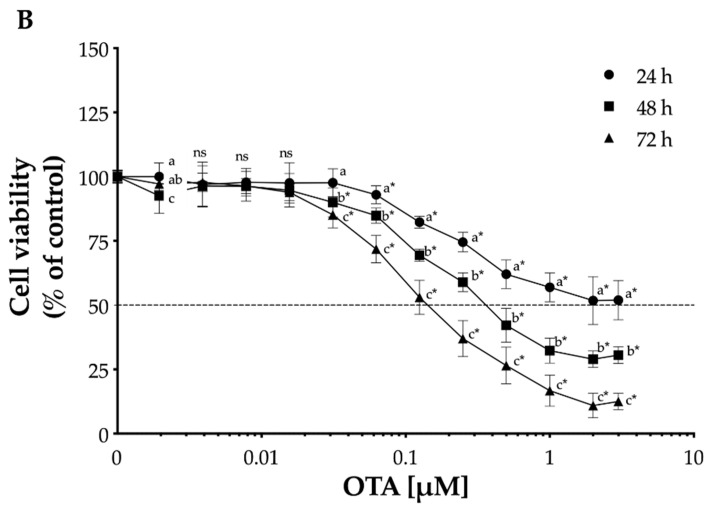
Figure 1.
Time- and concentration-dependent cytotoxicity of ochratoxin A (OTA) in proximal tubule epithelial cells. Cell viability was determined by the reduction in MTT after incubation with OTA for 24 h (•), 48 h (■), and 72 h (▲) in LLC-PK1 (A) and HK-2 (B) cells. Values are mean (n = 3) ± standard deviation, and they are expressed as percentage of control. The dotted line (···) represents the concentration of OTA that reduced the cell viability by 50%. Different letters indicate a statistically significant difference (p < 0.05) between values within the same OTA concentration by Tukey’s multiple comparison test, while ns = non-significant. Asterisks (*) indicate a statistically significant difference (p < 0.05) between values against each group control by Dunnett’s test.


