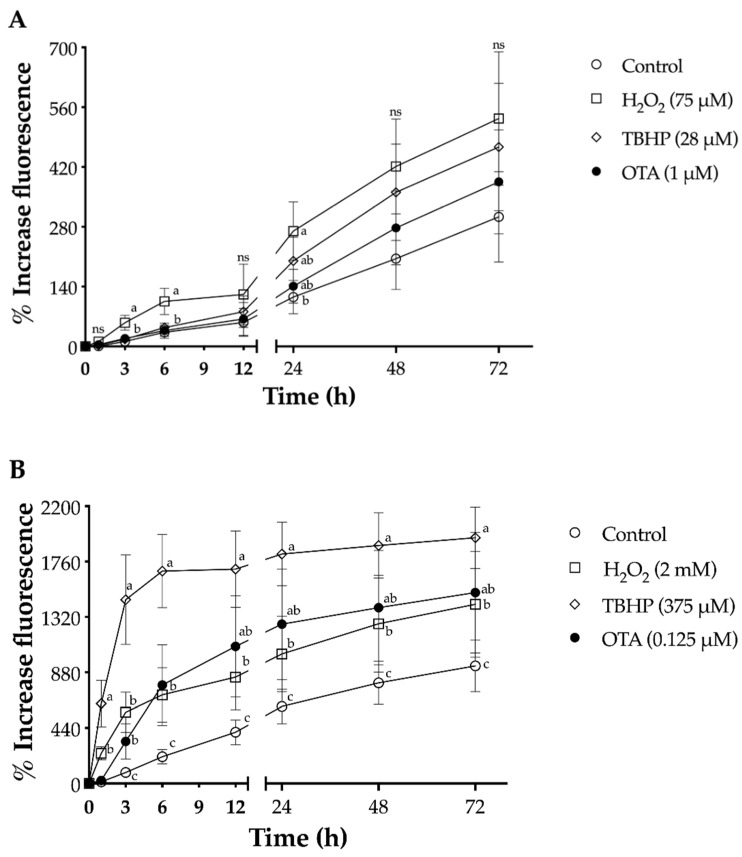
Figure 2.
Production of reactive oxygen species by H2O2, TBHP, and ochratoxin A (OTA) in proximal tubule epithelial cells at various exposure times up to 72 h. Increase in DCF fluorescence, upon oxidation of carboxy-H2DCF, was monitored after exposure to the test compound. (A) LLC-PK1 cells H2O2 (☐ ,75 μM), TBHP (△, 28 μM), and OTA (•, 1 μM); (B) HK-2 H2O2 (☐, 2 mM), TBHP (△, 375 μM), and OTA (•, 0.125 μM). In both cell lines, non-treated controls are denoted by open circles (◯). Values are mean (n = 3) ± standard deviation, and they are expressed as percentage increase in fluorescence from time zero. Different letters indicate a significant difference (p < 0.05) between treatments at each time by Tukey’s multiple comparison test, while ns = non-significant difference.

