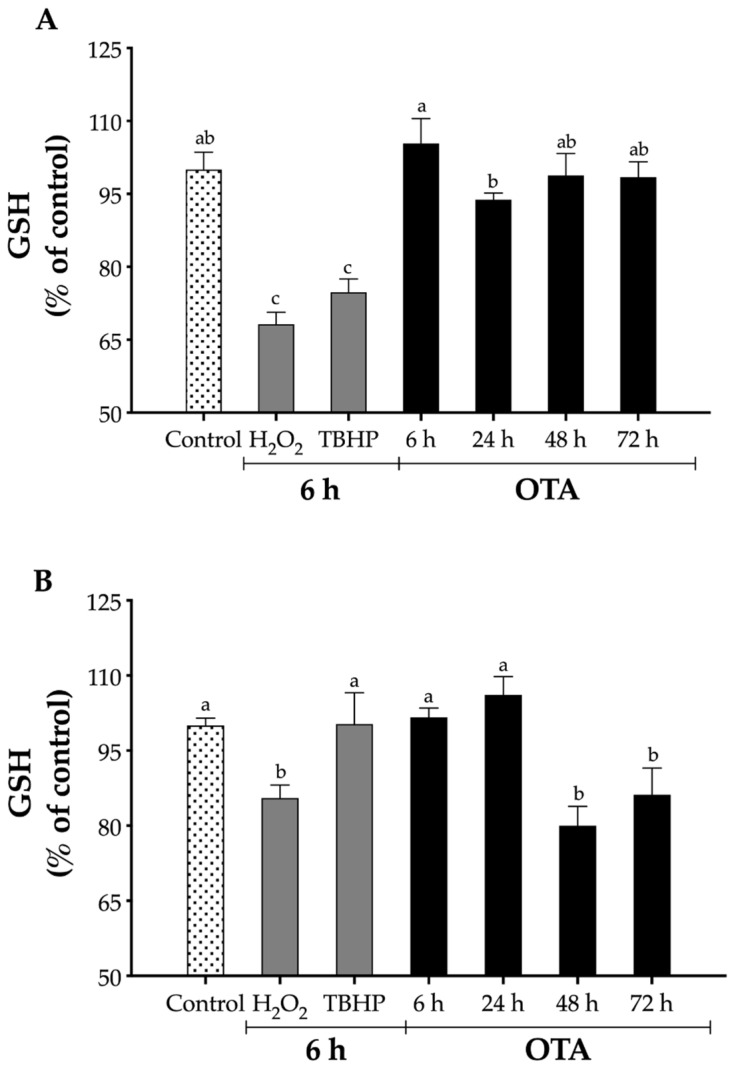
Figure 3.
Relative levels of GSH in proximal tubule epithelial cells. GSH levels were determined by the reaction with DTBN to form 5′-thio-2-nitrobenzoic acid in cells homogenates. (A) LLC-PK1 cells H2O2 (75 μM), TBHP (28 μM), and OTA (1 μM); (B) HK-2 H2O2 (2000 μM), TBHP (375 μM), and OTA (0.125 μM). Values are mean (n = 3) ± standard deviation, and they are expressed as percentage of control. Different letters indicate a statistically significant difference (p < 0.05) between treatments at each time by Tukey’s multiple comparison test.

