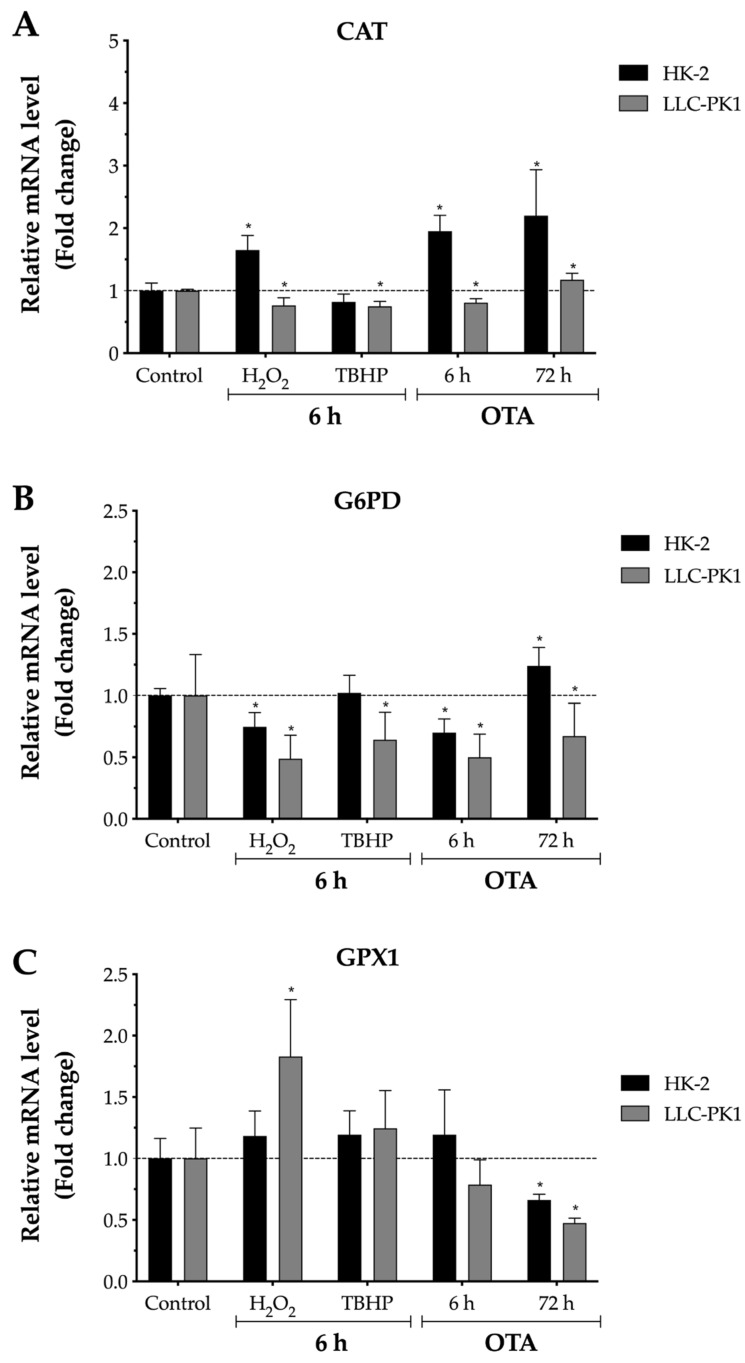
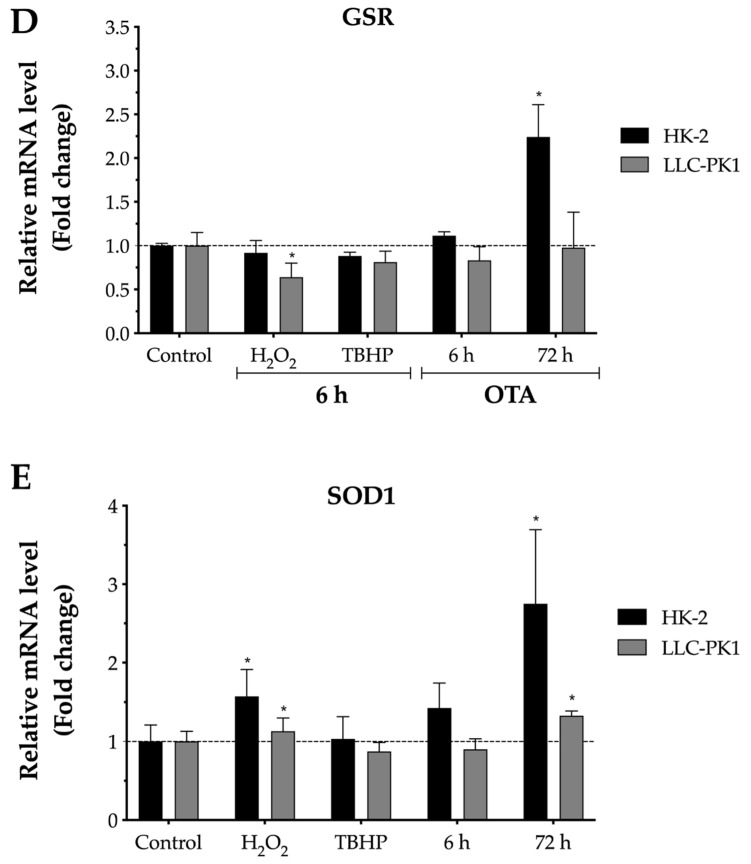
Figure 4.
Relative mRNA levels of CAT, G6PD, GSR, GPX, and SOD in proximal tubule epithelial cells after exposure to H2O2, TBHP, and ochratoxin A (OTA). The mRNA expression of each gene was normalized using GADPH mRNA expression as housekeeping gene. LLC-PK1 cells H2O2 (75 μM), TBHP (28 μM), and OTA (1 μM). HK-2 H2O2 (2 mM), TBHP (375 μM), and OTA (0.125 μM). (A) Catalase, CAT. (B) Glucose-6-phosphate dehydrogenase, G6PD. (C) Glutathione peroxidase 1, GPX1. (D) Glutathione reductase, GSR. (E) Superoxide dismutase 1, SOD1. Values are mean (n = 3) ± standard error of the mean, and they are expressed as fold change by the 2−ΔΔCt method. The dotted line (···) represents the level of mRNA for control cells. Asterisks (*) indicate a statistically significant difference (p < 0.05) between values against each cell line control by Student’s t-test. The fold change in OTA 72 h group was normalized with an independent control at 72 h.


