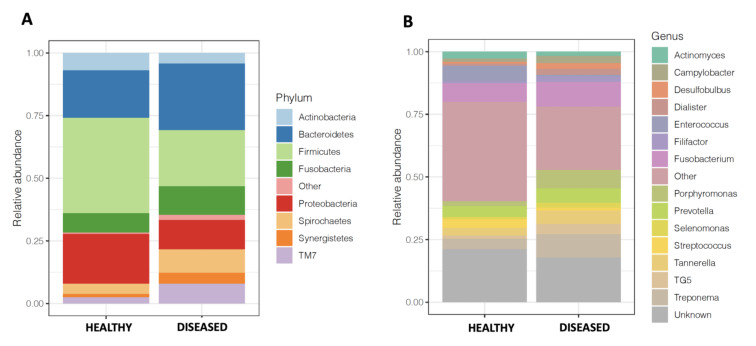
Figure 2.
Taxonomic profile of the oral microbiomes of the samples collected in periodontitis sites and healthy sites. (A) Mean relative taxa abundance plots for individuals from the samples collected in periodontitis sites and healthy sites, summarized at the phylum level. (B) Mean relative taxa abundance plots for individuals from the samples collected in periodontitis sites and healthy sites, summarized at the genus level.

