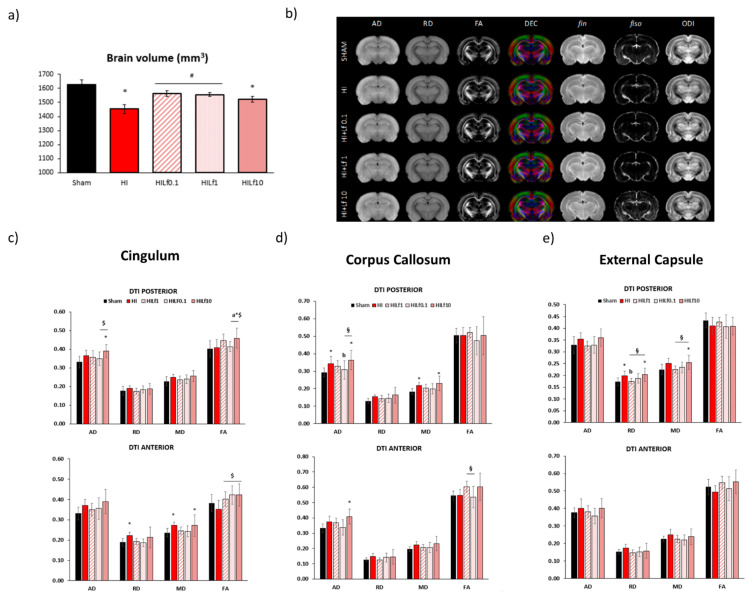
Figure 4.
MRI data at P25. Left upper panel (a)—brain volumes (mm3) (n = 5–8 animals/group). Right upper panel (b)—Diffusivity (mean, MD; axial, AD; radial, RD), fractional anisotropy (FA) and direction encoded colour (DEC) maps, intra-neurite volume fraction (fin), cerebrospinal volume fraction (fiso), and orientation dispersion index (ODI) maps. Maps correspond to the averaged maps over each group. Lower panels: histogram of diffusivities (mean, MD; axial, AD; radial, RD; ×10−4 mm2·s−1) and fractional anisotropy (FA) in the cingulate gyrus (left panels—c), corpus callosum (central panels—d) and external capsule (right panels—e). Results are mean ± SD. * HI vs. SH, $ difference between HILf groups. a b HILF0.1, or 1 vs. HI, respectively. Differences were determined by one-way ANOVA and considered significant when p < 0.05 (n = 5–8 animals/group).

