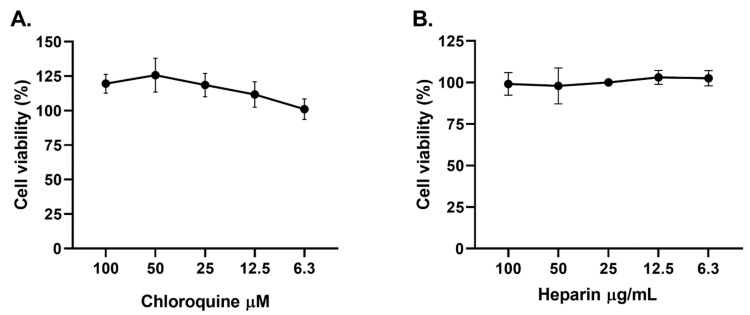
Figure 2.
Positive controls of viral inhibition showed low cytotoxicity on Vero E6. The figure represents the viability percentage of Vero E6 cells after 48 h of treatment with (A) CQ (6.3–100 µM) and (B) heparin (6.3–100 µg/mL). Bars represent mean values ± SEM. Two independent experiments with four replicates each experiment was performed (n = 8).

