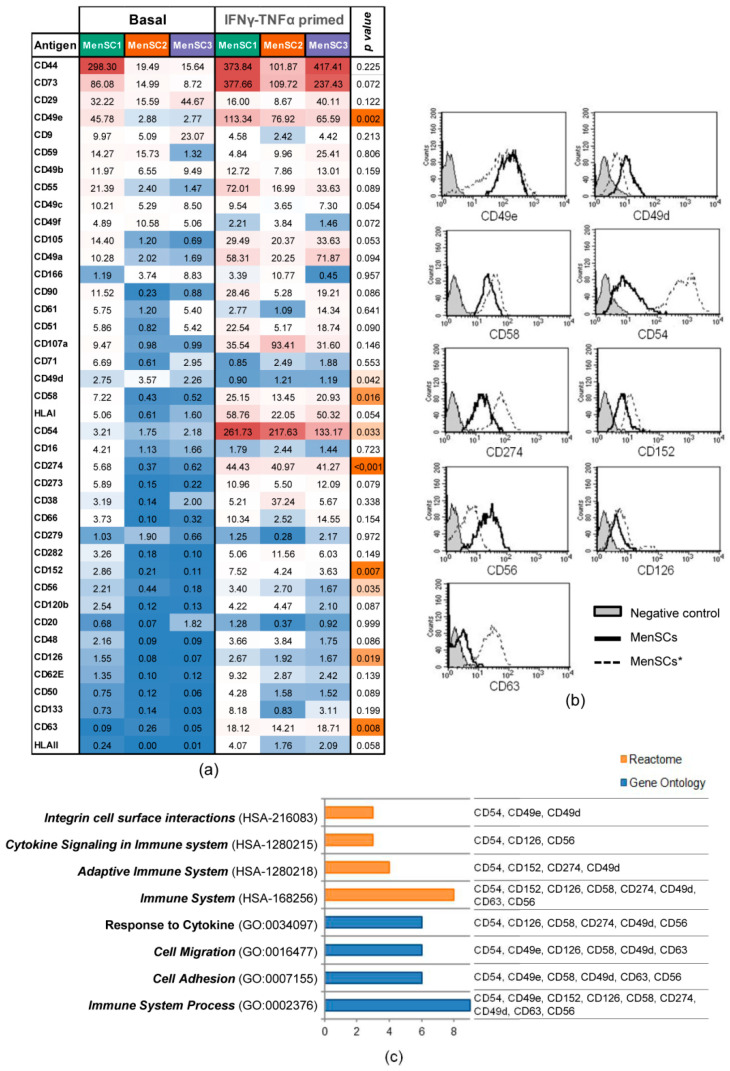
Figure 2.
Phenotypic surface marker expression on MenSCs. Analysis of surface markers in basal MenSCs (n = 3) and MenSCs* (n = 3) over 3 days. (a) The expression levels of 40 cell surface markers (Stain Index (SI) value) are illustrated on a heat map. A paired t-test was carried out to compare MenSCs and MenSCs*, where p < 0.05 was considered statistically significant. The color scale for the SI values illustrates the highest (red) and the lowest (blue) expression values, and the orange color scale indicates the grade of signification, with the most significant ones in dark orange. (b) Representative histograms of statistically different markers. The expression in MenSCs is represented by a black-lined histogram, and the expression of MenSCs* is represented by a discontinuous line. The opaque gray histogram corresponds to the fluorescence negative control. (c) Reactome and Gene Ontology enrichment analyses of statistically significant different markers were performed by adjusting the p value with Benjamini–Hochberg FDR correction < 0.01. Graph bars represent the number of surface markers annotated into Reactome (orange) and Gene Ontology (blue) categories.

