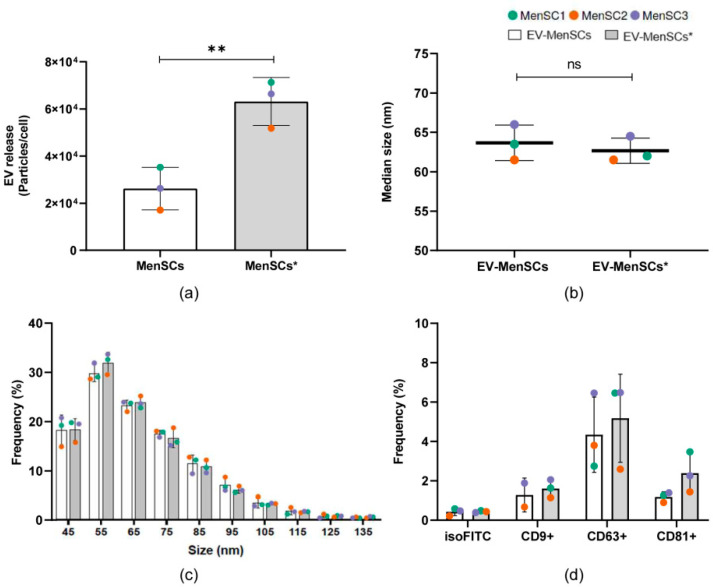
Figure 3.
Characterization of the EV fraction in the secretome of MenSCs. (a) EV release rate of MenSC under basal (white bars) and priming (gray bars) conditions. The number of particles released by MenSCs after 96 h was determined for the secretome samples (10,000× g supernatants) by nFC. Values were normalized to the total number of viable cells. (b) Median size (nm) of particles detected in EV-enriched fractions (EV-MenSCs) obtained after size exclusion chromatography (SEC) of the secretomes. (c) Histogram of particle size (SEC samples) with a bin width of 10 nm from primed (gray bars) and basal (white bars) MenSCs. Mean ± SD of the relative frequency of total events detected by nFC is shown. (d) Single-particle phenotyping of EV samples obtained by SEC. Three tetraspanin markers (CD9, CD63, and CD81) were evaluated by single-vesicle fluorescence analyses. Only those samples which showed positive staining were plotted. Different colored dots represent the values obtained with independent donors (n = 3). Significance was tested by a paired t-test. ** p < 0.01 in primed vs. basal conditions.

