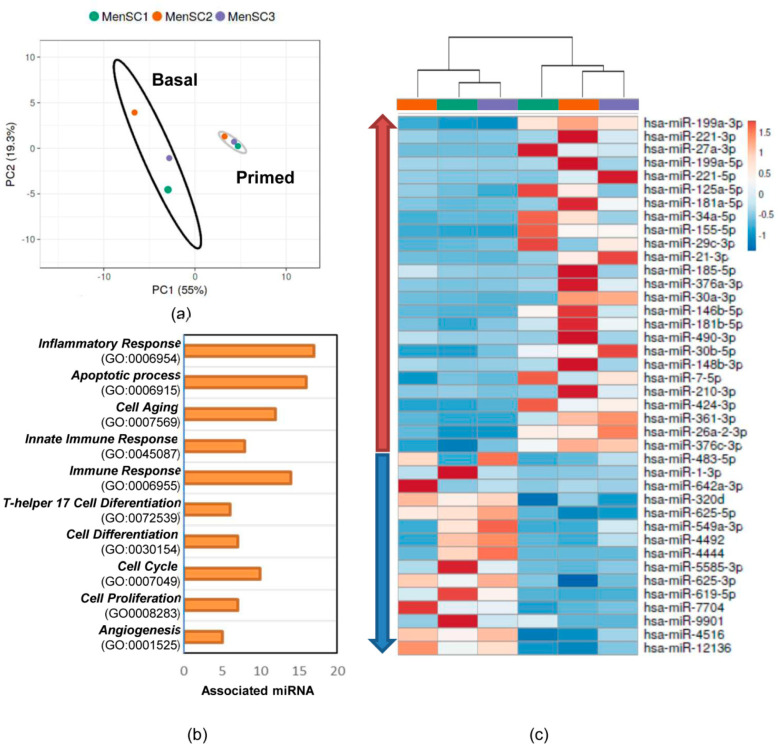
Figure 4.
Effects of IFNγ and TNFα priming on the miRNome of S-MenSCs. The 40 significantly regulated miRNAs in the S-MenSCs* were evaluated. (a) Principal component analysis (PCA) plots, with the score plot for PC1 (55% variance explained) vs. PC2 (19.3% variance explained). (b) Hierarchical clustering of the primary cells (MenSC1, MenSC2, and MenSC3) under different conditions (basal and IFNγ and TNFα priming) together with the heat maps of miRNAs. (c) Enrichment analysis revealed a significant implication of the selected miRNAs in the Gene Ontology categories (p value adjusted by Benjamini–Hochberg FDR correction < 0.01). Graph bars represent the number of associated miRNAs in each category.

