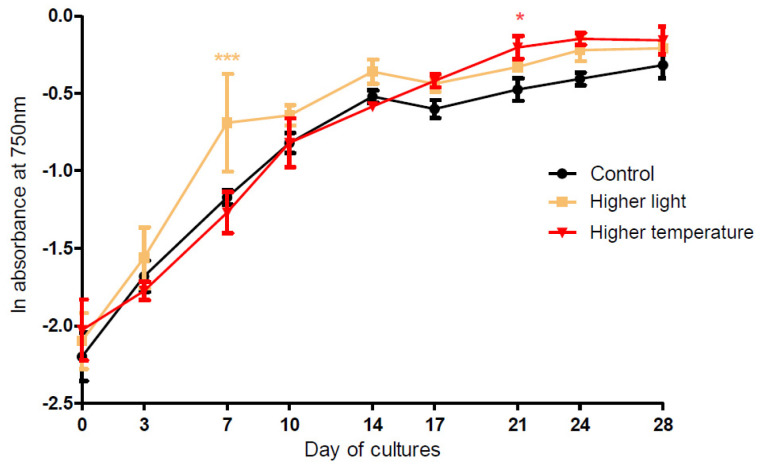
Figure 3.
Cell growth curves of Aliinostoc sp. PMC 882.14 according to different culture conditions (“control” 24 °C/12 µmol·m−2·s−1, “higher light” 24 µmol·m−2·s−1, “higher temperature” 28 °C) according to the number of culture days considering the in vivo absorbance at 750 nm (mean ± SD). Significant differences between control and treatments (“higher light” and “higher temperature”) were assessed by the ANOVA (p < 0.001 for higher light at D7 and p < 0.05 for the higher temperature at D21) corrected with Bonferroni’s test.

