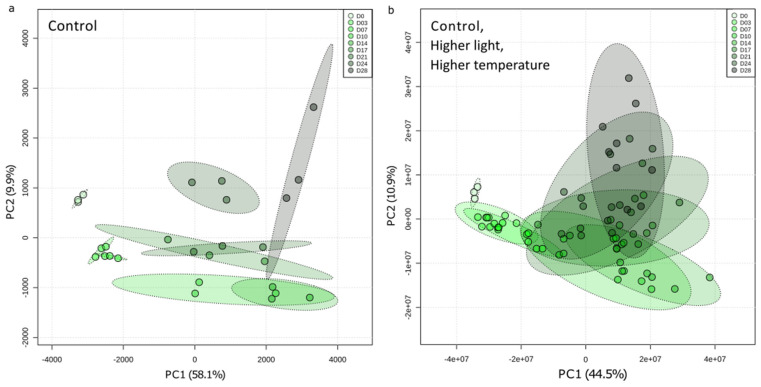
Figure 4.
Principal component analysis (PCA) representing the evolution of the intracellular metabolic composition of Aliinostoc sp. PMC 882.14 as a function of the number of culture days (a) under the control condition only, or (b) under control, “higher light”, and “higher temperature” conditions. Each point represents a culture replicate. The green gradient reflects the temporal scale of the cultures.

