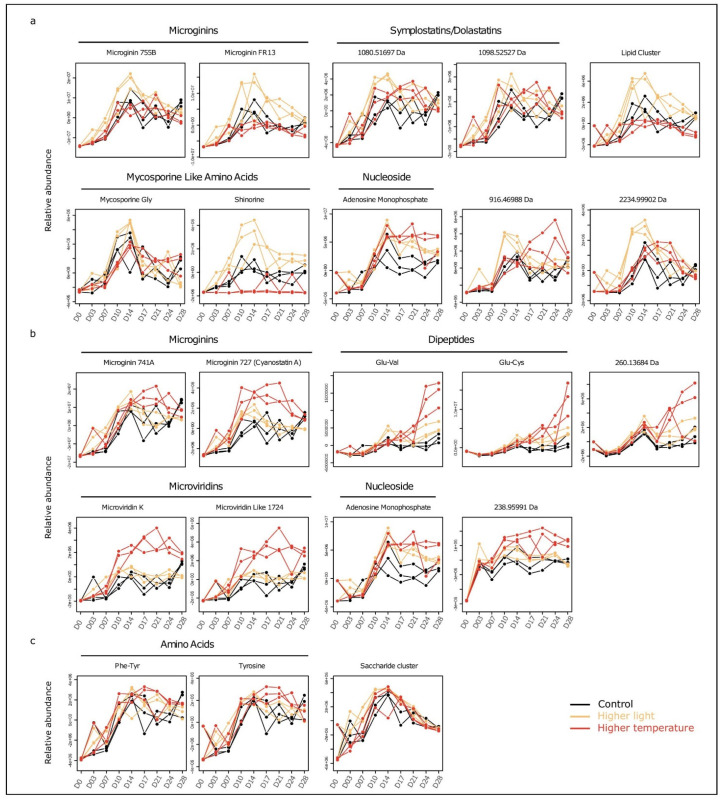
Figure 5.
Relative abundance profiles of a selection of 22 analytes among the 48 presenting the best MEBA (multivariate empirical Bayes analysis) classification scores, further confirmed by two ways ANOVA (p < 0.001). (a) Metabolites with a higher intracellular concentration in the “higher light” condition than in the control. (b) Metabolites with a higher intracellular concentration in the “higher temperature” condition than in the control. (c) Metabolites presenting a more complex pattern of regulation when compared to the control. Each line representing a different replicated culture.

