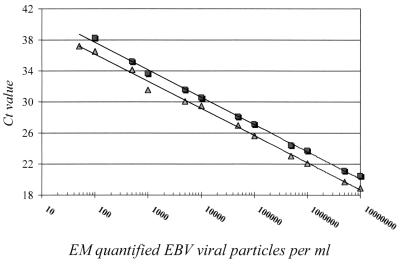
FIG. 1.
Standard curve for TaqMan PCR. Serial dilutions of the EBV EM standard ranging from 50 to 107 copies per ml were made. Extraction was performed by the method of Boom et al. (1) (triangles; Spearman correlation coefficient, 0.997) or the method with the High Pure Viral Nucleic Acid kit (squares; Spearman correlation coefficient, 0.998) as a matrix. Equal volumes of input and output material (100 μl) were used. The Ct values, which correspond to the PCR cycle number in which the value is above the threshold limit, are plotted against the calculated number of particles counted by electron microscopy.

