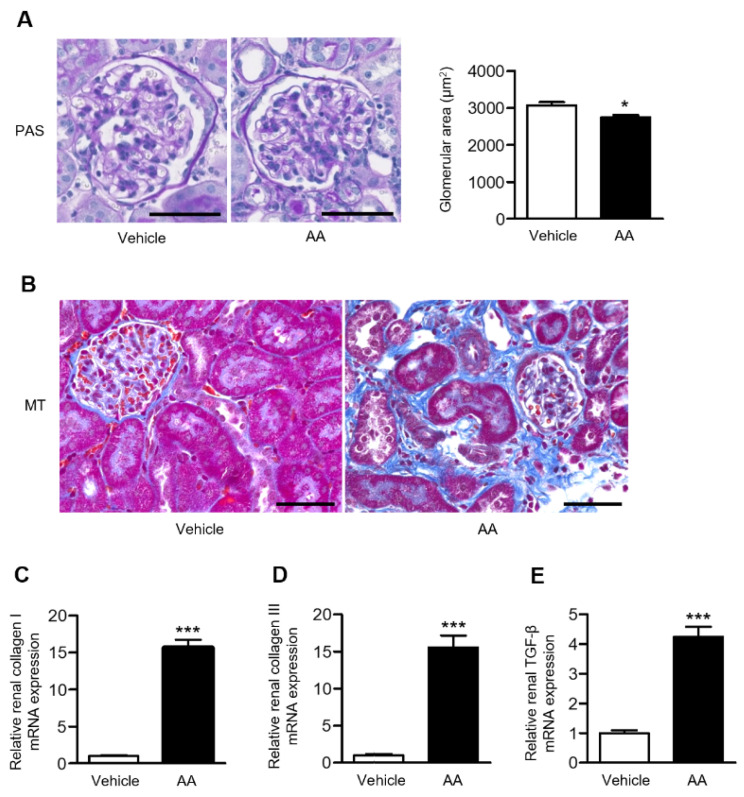
Figure 2.
Effects of AA treatment on renal pathological alterations assessed by histological examination and fibrosis-related gene expression. (A) Representative images of PAS-stained kidney sections (bar: 50 µm) and the glomerular area in the vehicle-control and AA groups. (B) Representative images of MT-stained kidney sections in the vehicle-control and AA groups (bar: 50 µm). Relative renal mRNA expression of (C) collagen I, (D) collagen III, and (E) TGF-β in the vehicle-control and AA groups. (A,C–E) * p < 0.05, *** p < 0.001 compared with the vehicle-control group. Data are presented as mean ± SEM (n = 4–5 per group) and were analyzed using the unpaired Student’s t-test. AA: aristolochic acid; MT: Masson’s trichrome; PAS: periodic acid-Schiff; TGF-β: transforming growth factor-β.

