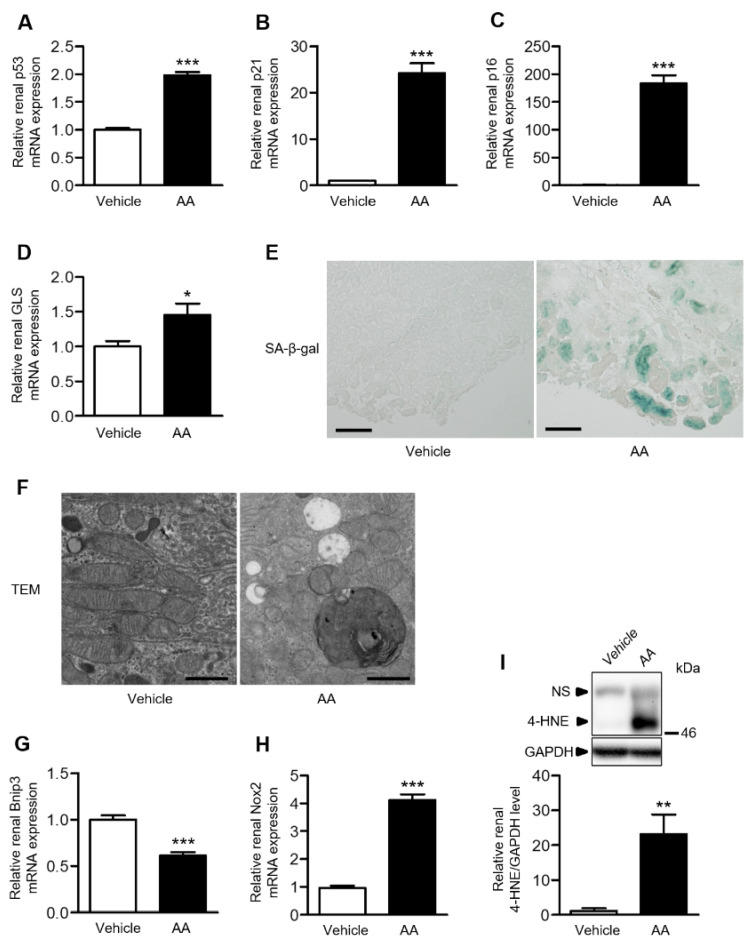
Figure 3.
Effects of AA treatment on proximal tubular cells and ROS. Relative renal mRNA expression of (A) p53, (B) p21, (C) p16, and (D) GLS. (E) Representative images of SA-β-gal-stained kidney sections in the vehicle-control and AA groups (bar: 100 µm). (F) Representative TEM images of the proximal tubular cells in the vehicle-control and AA groups (original magnification: ×5000; bar: 1 μm). Relative renal mRNA expression of (G) Bnip3 and (H) Nox2 in the vehicle-control and AA groups. (I) Relative renal 4-HNE level in the vehicle-control and AA groups. (A–D,G–I) * p < 0.05, ** p < 0.01, *** p < 0.001 compared with the vehicle-control group. Data are presented as mean ± SEM (n = 5 per group) and were analyzed using the unpaired Student’s t-test. 4-HNE: 4-hydroxy-2-nonenal; AA: aristolochic acid; Bnip3: BCL2/adenovirus E1B 19-kDa interacting protein 3; GAPDH: glyceraldehyde-3-phosphate dehydrogenase; GLS: glutaminase; NS: nonspecific band; SA-β-gal: senescence-associated β-galactosidase; TEM: transmission electron microscope.

