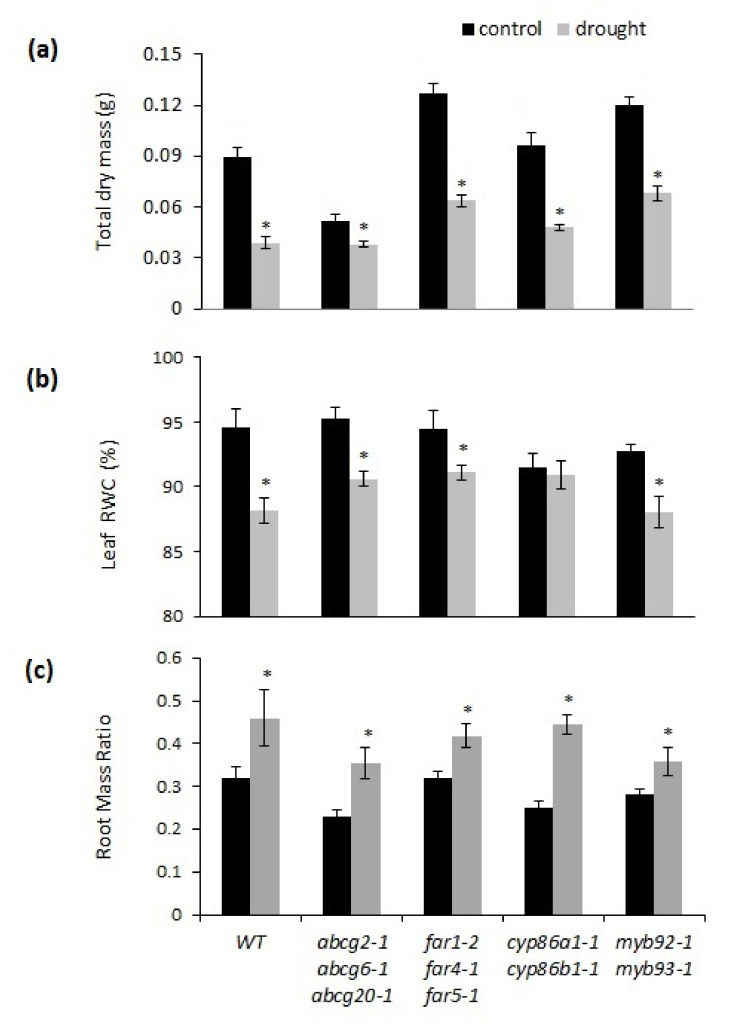
Figure 3.
Comparison of drought stress responses between wild-type and suberin mutants. (a) Total plant dry mass, (b) leaf relative water content (RWC), (c) root mass ratio (ratio between root dry mass and total dry mass). Mean values from ten replicate plants ± SE. ANOVA results indicated significant genotype and treatment interactions for total plant dry mass at p < 0.01, and for RWC at p < 0.05 (Table S1). Asterisks indicate significant differences by Student’s t-test at p < 0.05 comparing control and treatment.

