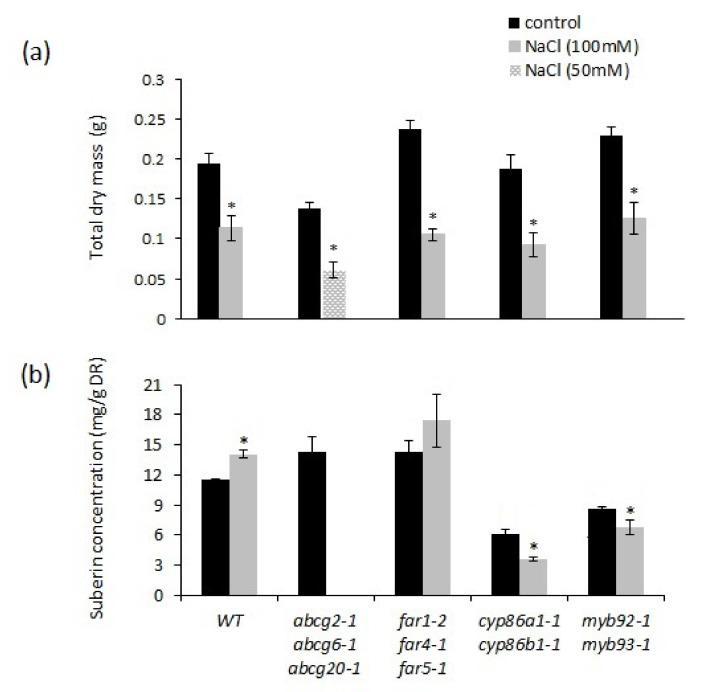
Figure 8.
Comparison of total dry mass and total suberin content in wild-type and suberin mutants under control and after treatment with 50 mM or 100 mM NaCl for 2 weeks. Wild-type, far1-2 far4-1 far5-1, cyp86a1-1 cyp86b1-1, and myb92-1 myb93-1 plants were exposed to 100 mM NaCl and abcg2-1 abcg6-1 abcg20-1 was exposed to 50 mM NaCl. (a) Total dry mass; (b) total poly-aliphatic suberin. Abcg2-1 abcg6-1 abcg20-1 NaCl treatment data are not included in Figure (b), as sufficient root biomass was not present at harvesting. Abcg2-1 abcg6-1 abcg20-1 mutant was also excluded from the statistical analysis. Mean values in dry mass are given in grams from ten replicate samples ± SE. Each replicate consisted of one individual plant. Mean values of suberin contents are given in milligrams of suberin per gram of delipidated dry residue (DR) from 3–4 replicate samples ± SE. Each replicate consisted of roots from 4–5 separate plants. ANOVA results indicated significant interactions between genotype and treatment effects in root suberin data at p < 0.01 (Table S2). Asterisks indicate significant differences by Student’s t-test at p < 0.05 comparing control and NaCl treatment.

