Figure 5.
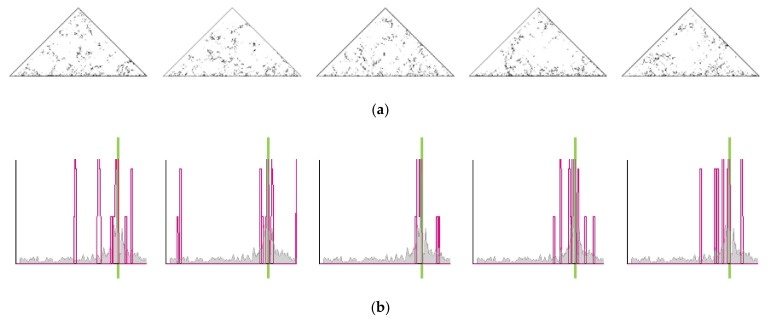
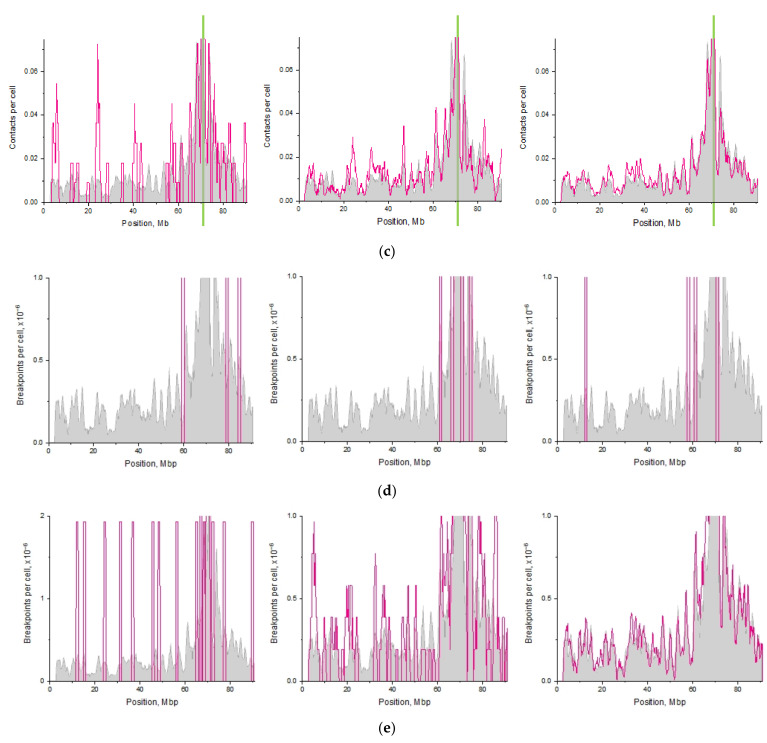
Single-cell, pooled and population-averaged distribution of contacts and translocation breakpoints. Chromosome 18, heteropolymer globule. (a) Single-cell chromosomal contact map, five individual cells. The black dots corresponding to the contacting pairs of loci are doubled in size for better visibility. (b) Single-cell distributions of the number of the contacts of any locus along the chromosome with the I-SceI site, five individual cells. The single-cell distribution is the sum of independent distributions for two chromosomes. (c) The distribution of the number of contacts (per cell) of any locus along the chromosome with the I-SceI site, averaged over a pool of 10, 100 and 1000 cells (left to right). The gray graph in panels (b,c) is the distribution of the number of contacts (per cell) of any locus along the chromosome with the I-SceI site, averaged over a pool of 2000 cells. The vertical green line denotes the position of the breaksite. The curves are smoothed as in the experimental study [21] (see Section 4). (d,e) Distributions along the chromosome of the number of breakpoints (per cell) averaged over a pool of a different number of cells. IR dose is 5 Gy. (d) 10 thousand cells, 3 independent repeats. (e) 100 thousand, 1 million, 25 million cells (left to right). The gray graph is the distribution for conventionally infinite cell population, averaged over a pool of 108 cells (see Section 4).


